どうも、Bokeh芸人のどりらんです。
Bokeh 0.13からRangeToolが使えるようになりました。
直近の時系列データみたいが、過去を遡ってみたい場合などに便利です。
グラフの範囲選択ツールで、Highstock などでは時系列データを可視化する際にデフォルトでついている機能だったりします。
おおまかな手順は下記のとおりです。
- RangeToolを描画するfigureインスタンス(図)を作成する
- RangeToolインスタンスを作成する
-
- の
add_toolsメソッドの引数に 2. を渡す
- の
RangeTool クラスにキーワード引数 x_range または y_range に Range1d インスタンスを渡すことで、X軸、Y軸の範囲を設定できます。
Range1d クラスとはなんぞやというかたは Jupyter本 を読むと幸せになれるでしょう。
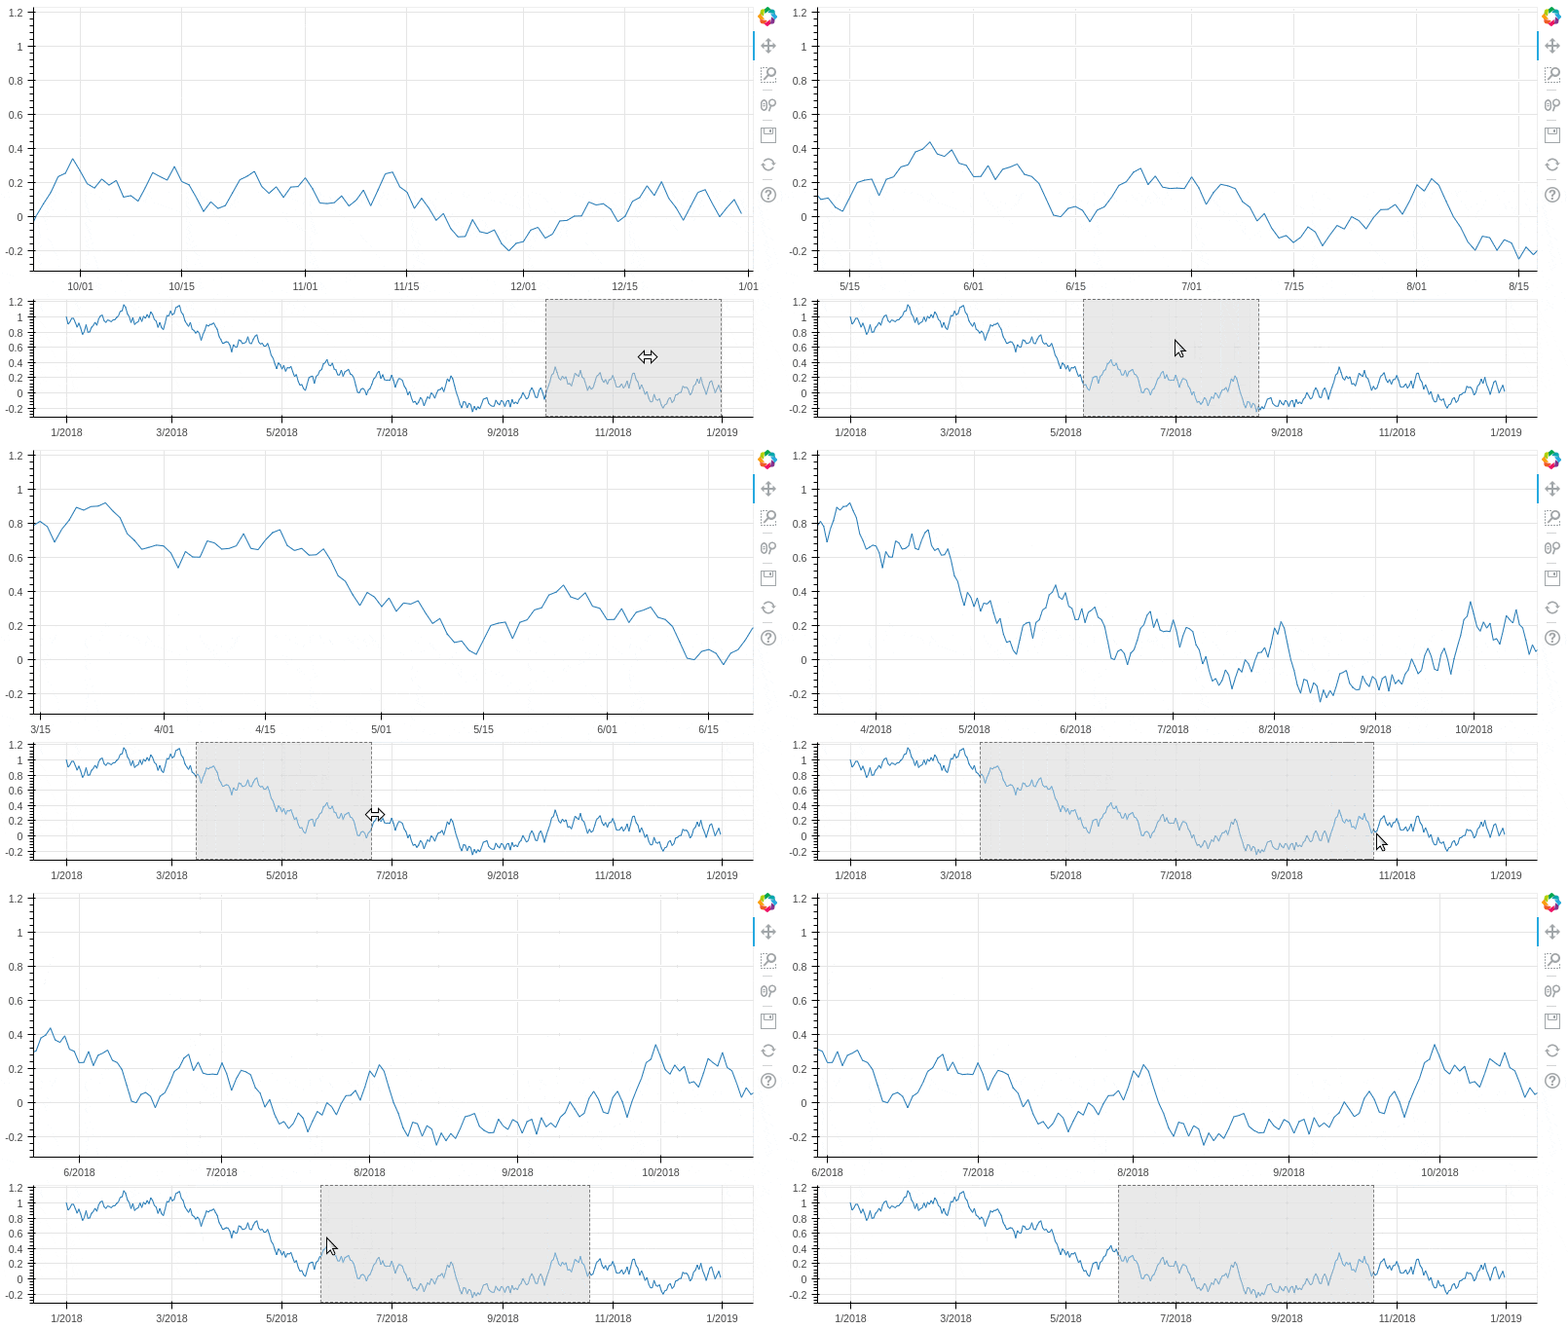
実際に時系列データを描画するとこんな感じになります。
import numpy as np
import pandas as pd
from bokeh.layouts import Column
from bokeh.models import RangeTool
from bokeh.plotting import figure, output_notebook, show

output_notebook()  # Jupyter Notebookに出力する場合

# データを乱数で適当に作成
x = pd.date_range("2018-01-01", periods=365)
np.random.seed(10)
y = np.random.uniform(-0.1, 0.1, 365)
y[0] = 1
y = y.cumsum()

# メインのfigure
p1 = figure(
    plot_height=300,
    plot_width=800,
    x_axis_type="datetime",
    x_range=(x[-100], x[-1]),  # X値の描画範囲, Range1dオブジェクトが作成される (1)
)
p1.line(x, y)

# RangeToolのfigure
p2 = figure(
    plot_height=150,
    plot_width=800,
    y_range=p1.y_range,
    x_axis_type="datetime",
    toolbar_location=None,
)
p2.line(x, y)
range_rool = RangeTool(x_range=p1.x_range)  # (1) で作成されたRange1dオブジェクト
p2.add_tools(range_rool)

show(Column(p1, p2))
実際にぐりぐり動かしてみたいかたは ブログ でどうぞ。
RangeToolの書式を設定できます。詳細についてはドキュメントなどを参照してください。
本記事のコードは公式ドキュメントのGALLERY の内容を端折って書いています。
