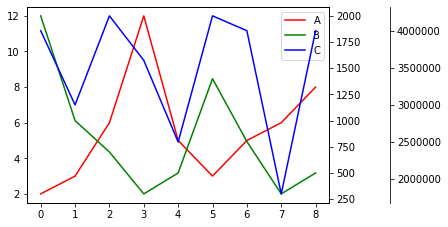
横軸は同じだけどスケールの異なるデータを3つ以上描きたい時ってたくさんあると思います。
この記事ではy軸が3つの折れ線グラフを描きます。
データはこれを使います。
index	A	  B	   C
0	  2	  2000  4000000
1	  3	  1000  3000000
2	  6	  700	 4200000
3	  12  300	 3600000
4	  5	  500	 2500000
5	  3	  1400  4200000
6	  5	  800	 4000000
7	  6	  300	 1800000
8	  8	  500	 4000000
↑indexを横軸にして、A, B, Cの折れ線グラフを書くなら縦軸のスケールを変えたほうがいいですよね。
そんなわけでやっていきましょう。 いろいろimportimport pandas as pd
import matplotlib as mpl
import matplotlib.pyplot as plt
fig=plt.figure()
fig.subplots_adjust(bottom=0.2)
fig.subplots_adjust(right=0.85)
fig.subplots_adjust(left=0.15)
ax1=fig.add_subplot(1,1,1)
ax2=ax1.twinx()
ax3=ax1.twinx()
ax1.set_xlabel('index',fontsize=18)
ax1.set_ylabel('A',fontsize=18 ,color='red')
ax2.set_ylabel('B',fontsize=18 ,color='green')
ax3.set_ylabel('C',fontsize=18 ,color='blue')
rspine = ax3.spines['right']
rspine.set_position(('axes', 1.2))
ax1.plot(df['A'],color='red',label="A")
ax2.plot(df['B'],color='green',label="B")
ax3.plot(df['C'],color='blue',label="C")

h1, l1 = ax1.get_legend_handles_labels()
h2, l2 = ax2.get_legend_handles_labels()
h3, l3 = ax3.get_legend_handles_labels()
ax1.legend(h1 + h2 +h3, l1 + l2 +l3 ,loc='upper right')
参考
https://matplotlib.org/3.1.1/gallery/ticks_and_spines/spine_placement_demo.html


