はじめに
アトラクターは物理の世界から出てきたトピックで、今も活発に研究が続いているようです。その中でもストレンジアトラクターと言われるものは身近な存在で、見た目が面白いのでスクリーンセーバーなど色々なところでみるかと思います。この記事ではnyaplotとrb-gslを使ってStrange Attractorの内いくつかを作ってみます。Nyaplotについてはこのブログ記事をご覧ください。
記事中のコードは全てこちらのノートブックでご覧いただけます。
準備
必要なgemをインストールします。nyaplotはgem install nyaplotでインストールできます。必須ではありませんがgem install nyaplot-utilsでnyaplotの補助ライブラリがインストールできます。
また、rb-gslのインストール方法についてはこちら、IRubyのインストール方法についてはこちらをご覧ください。
インストール後全てのライブラリをrequireします。
require 'gsl'
require 'nyaplot'
require 'nyaplot3d'
require 'nyaplot_utils'
Modified Chua attractor
元となったChua's attractorはコイルとコンデンサ2つ、抵抗、ダイオードから成る回路に電流を流したとき、両コンデンサの両端の電位差とコイルに流れる電流の間に成り立つ関係をプロットしたものだそうです。式は以下のようになります。
\frac{dx}{dt}=\alpha [y-x-f(x)]\\
\frac{dy}{dt}=x-y+z\\
\frac{dz}{dt}=-\beta y
(出展: http://en.wikipedia.org/wiki/Chua's_circuit)
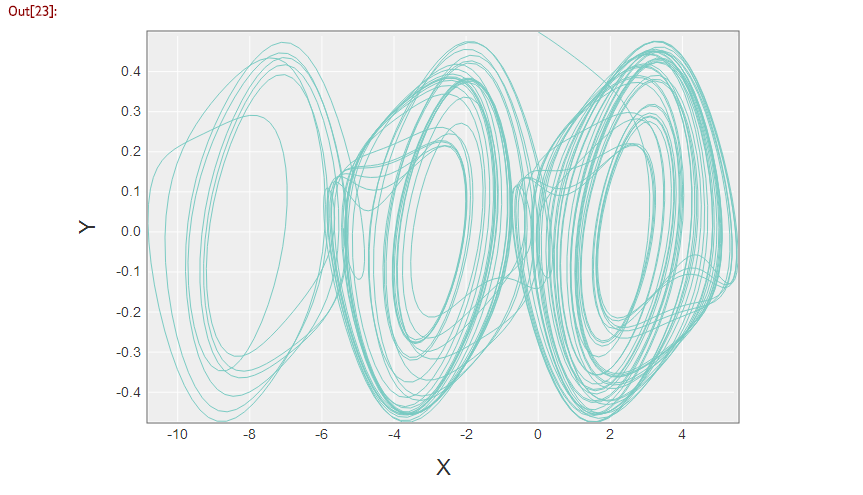
Modified Chua attractorはこの式の一部を改変して渦が複数になるようにしたもので、その式は以下のようになります。
\frac{dx}{dt}= \alpha*(y-h)\\
\frac{dy}{dt}=x-y+z\\
\frac{dz}{dt}=-\beta*y\\
h := -b*sin(\frac{\pi*x}{2*a}+d)
(出展: http://en.wikipedia.org/wiki/Multiscroll_attractor)
いずれともパラメータは3つです。それではrb-gslに用意されているOdeivモジュールで上の微分方程式を解いてみます。Odeivモジュールのドキュメントはこちら。
alpha = 10.82
beta = 14.286
a = 1.3
b = 0.1
d = 0.2
func = lambda {|x| return -b*Math.sin((Math::PI*x)/(2*a)+d)}

ode_func = Proc.new { |t, y, dydt, mu|
  dydt[0] = alpha*(y[1] - func.call(y[0]))
  dydt[1] = y[0] - y[1] + y[2]
  dydt[2] = -beta*y[1]
}

solver = GSL::Odeiv::Solver.alloc(GSL::Odeiv::Step::RK8PD, [1e-11, 0.0], ode_func, 3)

t = 0.0       # initial time
t1 = 250.0    # end time
h = 1e-11      # initial step
y = GSL::Vector.alloc([0, 0.49899, 0.2]) # initial value
mat = []

while t < t1
  t, h, status = solver.apply(t, t1, h, y)
  break if status != GSL::SUCCESS
  mat.push([t, y[0],y[1],y[2]])
end
この結果をNyaplot::DataFrameに入れて内容を確認してみます。
mat = mat.transpose
df = Nyaplot::DataFrame.new({t: mat[0], x: mat[1], y: mat[2], z: mat[3]})
df
IRuby上であれば以下のようなテーブルが表示されるはずです。

一見したところN/Aもなく、上手く計算できているようです。それではこの結果をプロットしてみます。
plot = Nyaplot::Plot.new
line = plot.add_with_df(df, :line, :x, :y)
line.stroke_width(1)
plot
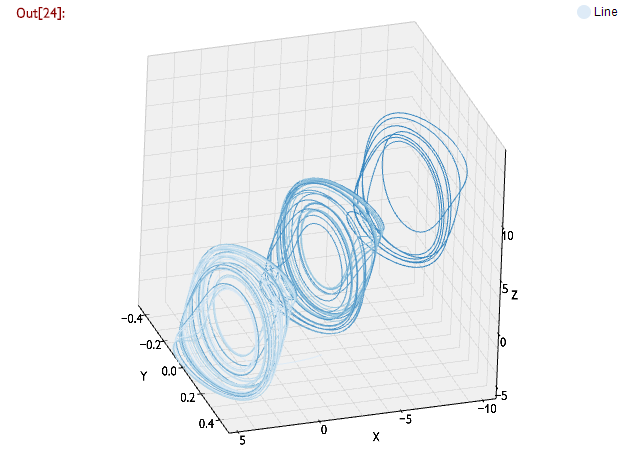
できました!次にNyaplot3Dを使って3Dで表示してみます。
plot = Nyaplot::Plot3D.new
plot.add_with_df(df, :line, :x, :y, :z)
plot
以上のプロットを拡大/縮小・回転などしながらご覧になるにはこちらをご覧ください。
Tamari's Attractor
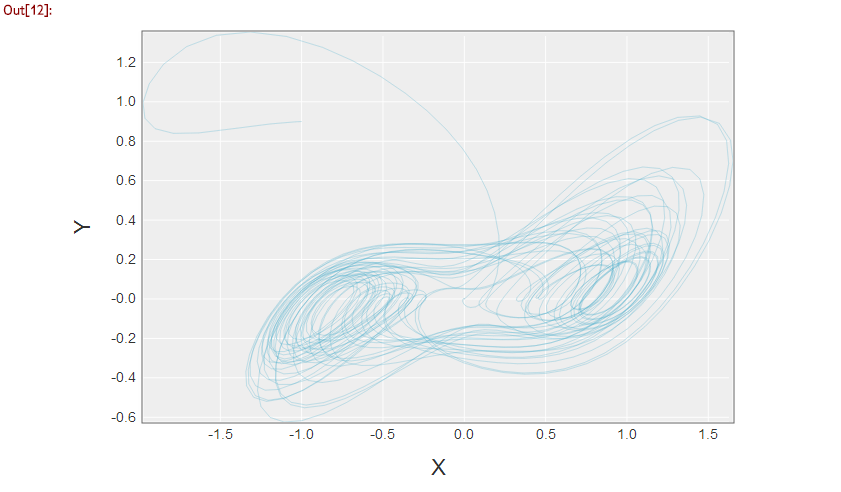
国の経済をモデル化してできたattractorのようです。式は以下のようになります。
\frac{dx}{dt} = (x - ay)cos(z) - b*ysin(z)\\
\frac{dy}{dt} = (x + cy)sin(z) + d*ycos(z)\\
\frac{dz}{dt} = e + fz + g*atan(\frac{(1 - u)}{(1 - i)*xy})
(出展: http://www.bentamari.com/attractors.html)
Chua attractorと同じ要領でOdeivモジュールを使って解いてみます。
a=1.013; b=-0.021;c=0.019;d=0.96;e=0;f=0.01;g=1;u=0.05;i=0.05
ode_func = Proc.new { |t, y, dydt, mu|
  dydt[0] = (y[0]-a*y[1])*Math.cos(y[2])-b*y[1]*Math.sin(y[2])
  dydt[1] = (y[0]+c*y[1])*Math.sin(y[2])+d*y[1]*Math.cos(y[2])
  dydt[2] = e + f*y[2] + g*Math.atan(((1-u)*y[1]) / (1-i)*y[0])
}

solver = GSL::Odeiv::Solver.alloc(GSL::Odeiv::Step::RK8PD, [1e-10, 0.0], ode_func, 3)

t = 0.0
t1 = 800.0
h = 1e-10
y = GSL::Vector.alloc([0.9,1,1])
mat = []

while t < t1
  t, h, status = solver.apply(t, t1, h, y)
  break if status != GSL::SUCCESS
  mat.push([y[0],y[1],y[2]])
end

mat = mat.transpose
df = Nyaplot::DataFrame.new({x: mat[0], y: mat[1].map{|v| -v}, z:mat[2]})

plot = Nyaplot::Plot.new
line = plot.add_with_df(df, :line, :y, :x)
line.stroke_width(0.3)
line.color(color.to_a[5])
plot
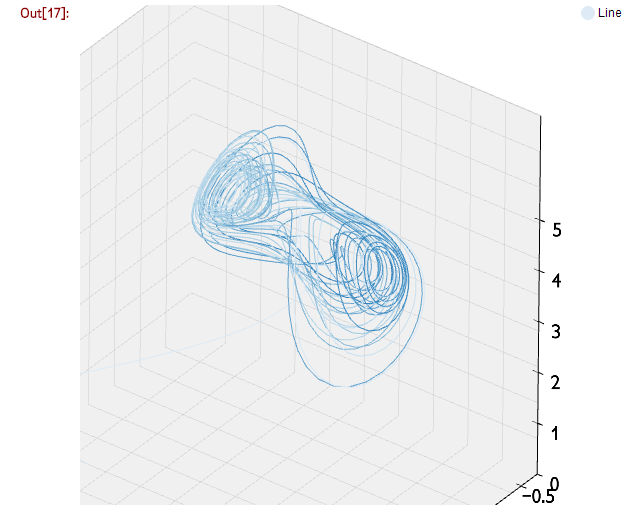
3Dでも表示させてみます。
zplot = Nyaplot::Plot3D.new
plot.add_with_df(df, :line, :x, :y, :z)
plot
画像のエクスポート
nyaplot-utilsを使うことで作ったプロットをSVGファイルに保存することができます。
Nyaplot::Plot#export_svgで軸も含めた画像全体を、Nyaplot::Plot#export_contentsでプロットの内容だけを保存することができます。
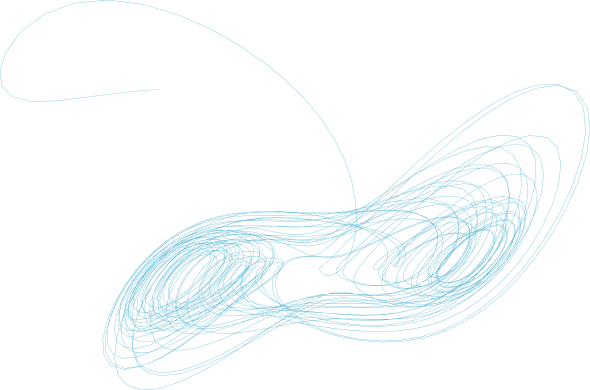
下図はexport_contentsで出力したSVGファイルをpngに変換したものです。
plot.export_contents 'context.svg'
雑感
色々初期値をいじってみたのですがChua attractorがあまりきれいにならなかったので上手い初期値を教えていただけると嬉しいです。
例を作るため見栄えの良いattractorがないかと探して作ったものなので正確さは期待しないようお願いします。
見栄えとプロットのしやすさを重視するならばNyaplotは使い勝手がよく、現時点において最適解なのではないかと思います。
Nyaplotにはこのほかにも色々な例があります。是非ご覧ください。
