はじめに
クソデカデータ1をplotに渡すと,表示までにかなりの時間がかかる.
解決方法の一つとして,データをあらかじめ間引いてデータサイズを削減してからplotに渡す処理が考えられる.
今回はまずmatlab標準の関数を使って目的を達成出来るか検討して,次に間引き処理を手実装(車輪の再発明)して結果を確認する.
matlab標準の関数(decimate)
間引き処理といえばSignal Processing ToolBoxにdecimateという関数がある.
% 信号を生成
Fs = 44100;
T = 10;
N = Fs * T;
t = ((1:N)-1)/Fs;
y = 0.1 * rand(1, N);
y = y - mean(y);
% 1s及び5sにトランジェント成分がある信号
y(Fs:Fs+100) = 1;
y(Fs*5:Fs*5+100) = -0.5;


subplot 211
plot(t, y);
str = sprintf('Original Data(N=%d)', length(y));
title(str);
grid on
ylim([-1 1]);
xlabel('t[s]');

decimation = 100;% 間引き量
y2 = decimate(y,decimation);
t2 = ((1:length(y2))-1)/Fs*decimation;
subplot 212
plot(t2, y2);
str = sprintf('Decimated Data(N=%d)', length(y2));
title(str);
grid on
ylim([-1 1]);
xlabel('t[s]');
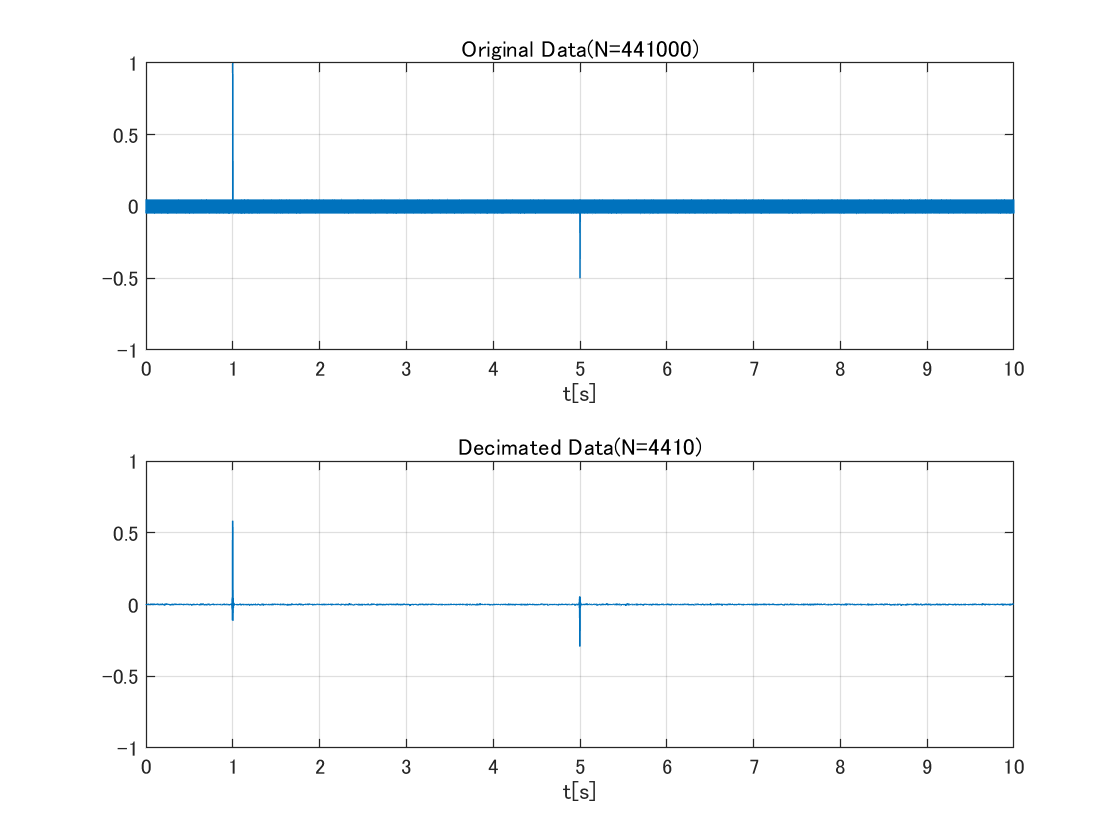
decimateの結果
オリジナルデータとdecimateした後のデータを比較すると,データ数は削減出来たものの,だいぶ見た目が変わっている.$1\rm{[s]}$と$5\rm{[s]}$にあるトランジェント成分の振幅が小さくなっている.今回の用途にはちょっと合わなかった感じ.
間引き処理を手実装
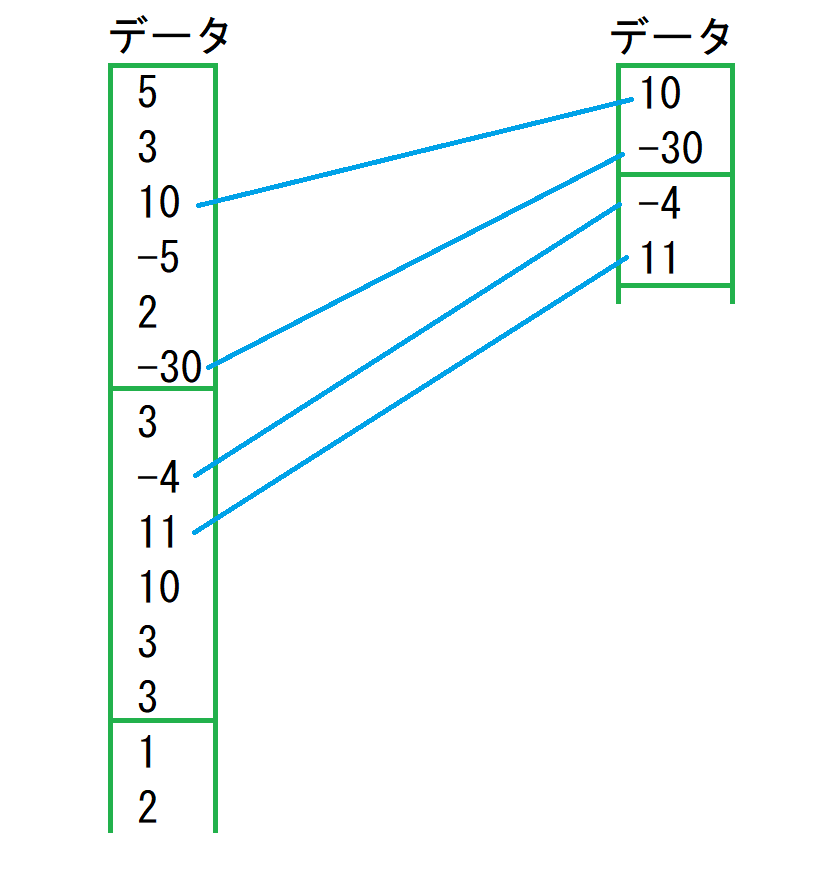
見たいのは信号の最大値と最小値なので,それを抽出する処理を作る.
図にするとこんな感じ.スライド窓の最大値と最小値を抜き出す.

こういう処理って何か名称があるんですかね?
たぶん世にある様々な描画処理はこれを行ってると思うのだけれど…
実装
function y = DecimationProc(x, r)
r2 = r * 2;
% length(x)がr2の倍数となるようにxをゼロパディング
mod1 = mod(length(x), r2);
if(mod1 == 0)
    x2 = x;
else
    x2 = [x; zeros(r2 - mod1, 1)];
end

% N行1列の行列を、r2行(N/r2)列の行列に変換(max, min処理のため)
x2 = reshape(x2, [r2, length(x2)/r2]);
% 各列のmax/minを求めて、1行(N/r2)列のmax/min行列を取得
[x2_max, x2_max_ind] = max(x2);
[x2_min, x2_min_ind] = min(x2);


% 各列のmaxとminを順番を整列してyに格納
y = zeros(ceil(length(x)/r2), 1);
for n = 1:length(x2_max)
    if(x2_max_ind(n) > x2_min_ind(n))
        y(2 * n - 1) = x2_min(n);
        y(2 * n) = x2_max(n);
    else
        y(2 * n - 1) = x2_max(n);
        y(2 * n) = x2_min(n);
    end
end
% r点から1点選ぶのではなく,2*r点から2点選ぶという処理になっているため,yは2*rの倍数となってしまう
% それを補正する処理
n1 = (ceil(length(x)/r));
if(length(y) > n1)
    y = y(1:n1);
end
end
全体的に汚いし,マルチチャネルとかには対応してないので改良の余地がでかすぎるわね…
for文の処理とかもっとmatlabチックな書き方がありそうだけど,よく分からない.(よわよわプログラマ)
何となく動いているのでヨシ!
結果
手実装した間引き処理を使って処理した結果をグラフに描く.
decimatedData = DecimationProc(y, decimation);
subplot 313

t3 = ((1:length(decimatedData))-1)*decimation/Fs;
plot(t3, decimatedData);
grid on
ylim([-1 1]);
str = sprintf('Decimated Data2(N=%d)', length(decimatedData));
title(str);
xlabel('t[s]');
オリジナルと波形の見た目が一致した.
結果2(拡大)
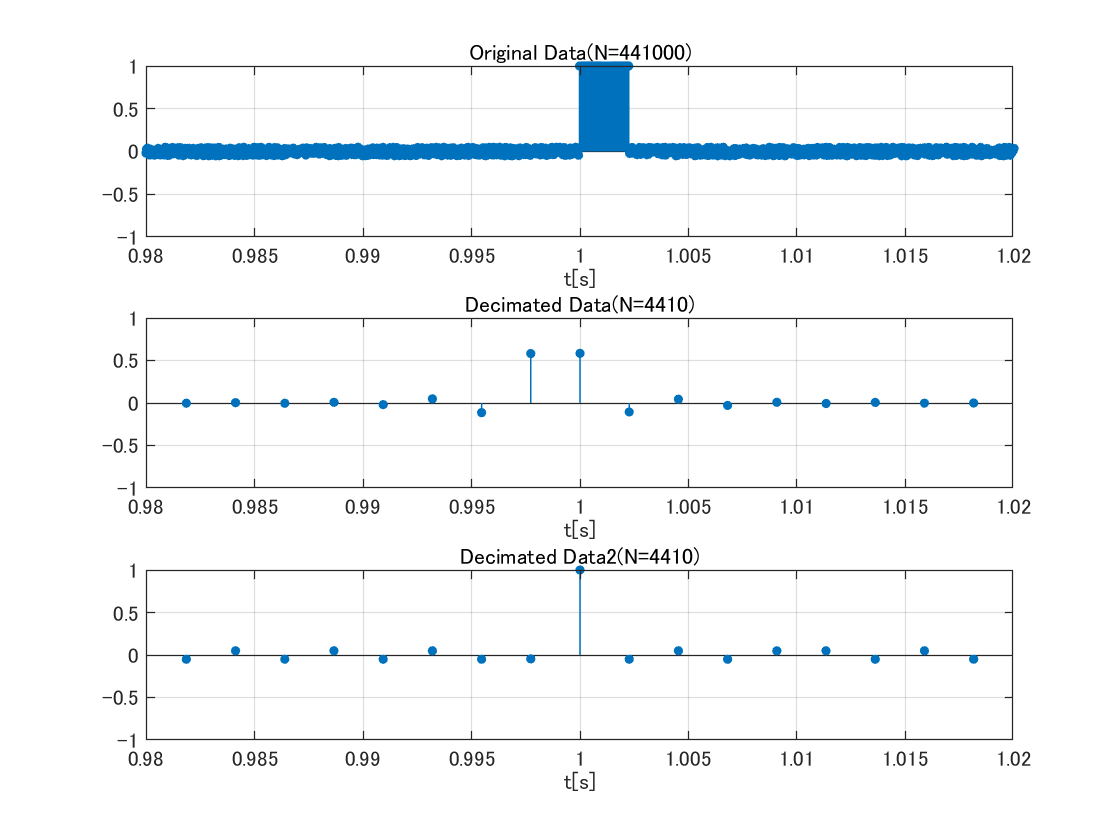
1[s]付近を拡大してstem関数でグラフを描いてみる.
結果3(音楽データ)
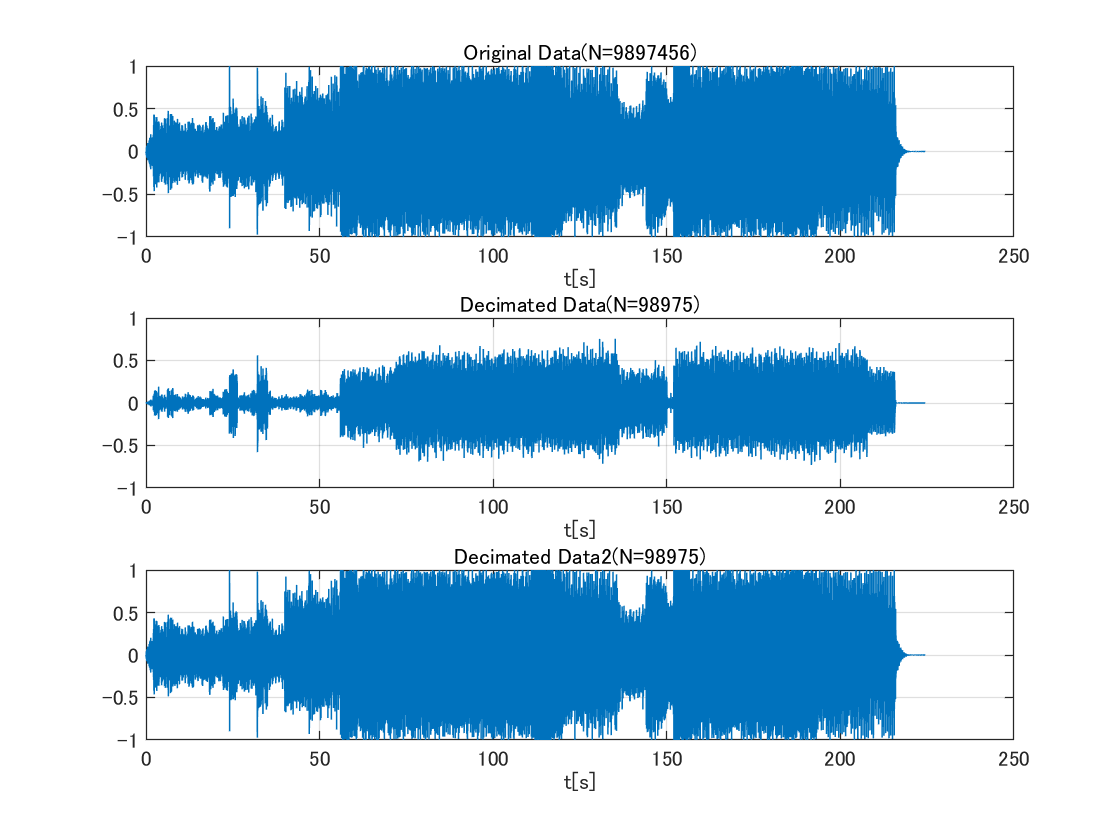
フリー音源を読み込んで,同様に間引き表示した.

こっちもいい感じに表示出来ている.
-
https://anond.hatelabo.jp/20200611125508
音楽データなら1曲あたり5分間くらいなのでまぁまぁなのだが,業務で取り扱うデータだとサンプリング周波数が$200\rm{[kHz]}$で長さが数時間単位だったりしてそこそこ重たい. ↩


