Excelで描けるようなグラフを、pythonで描くことができます。
その機能を提供しているのがmatplotlibというパッケージ。
Excelで描けるものをスクリプト言語で描く意味は、主に自動化のためですかね…。
日々更新される類のデータを定期的に取得してグラフ化し、その画像をメールで送信するのを自動化するような用途で使えます。
ここでは例として、文部科学省が公表している国立私立大の授業料推移データを使います。
以下のようにdata.csvファイルとして保存します。(vimで空白を,に置換する等、適当に整形してあります)
年度,授業料(円),入学料(円),検定料(円),授業料(円),入学料(円),検定料(円),授業料(倍),入学料(倍),検定料(倍)
昭和50年,36000,50000,5000,182677,95584,9647,5.1,1.9,1.9
昭和51年,96000,50000,7500,221844,121888,11452,2.3,2.4,1.5
昭和52年,96000,60000,7500,248066,135205,13084,2.6,2.3,1.7
昭和53年,144000,60000,10000,286568,157019,14722,2,2.6,1.5
...
国立私立それぞれの授業料実データ部分をpythonで読み取り、リスト化して、ラベル設定や判例表示設定など調整し、最後にgraph.pngに書き出しています。
from matplotlib import pyplot

with open("data.csv", "r", encoding="shift-jis") as fp:
    x, xlabels = [], []
    y1, y2 = [], []
    for linenum, line in enumerate(fp):
        if linenum is 0:
            continue
        x.append(linenum)
        xlabels.append(line.split(",")[0])
        y1.append(line.split(",")[1])
        y2.append(line.split(",")[4])

# x軸のラベル設定
pyplot.xticks(x, xlabels, rotation=90)
# x軸のラベル表示スペースを拡大
pyplot.subplots_adjust(bottom=0.2)

# cyanの実線で描画
pyplot.plot(x, y1, 'c-', label="国立大学")
# magendaの実線で描画
pyplot.plot(x, y2, 'm-', label="私立大学")

# grid, title, 凡例表示
pyplot.title("国立大学と私立大学の授業料等の推移")
pyplot.legend()
pyplot.grid()

# pyplot.show()
pyplot.savefig("graph.png")
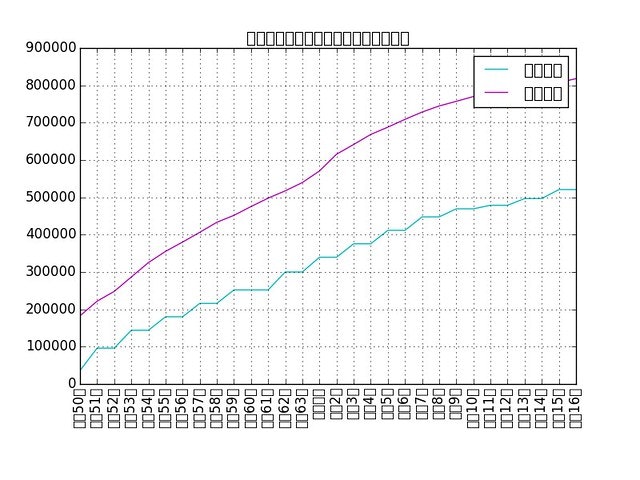
その結果が以下の図です。
いわゆる豆腐ですね…。これはmatplotlibが日本語フォントを持たないためです。
ちょっと古い上、python2の情報ですが、How to set Helvetica as the default sans-serif font in Matplotlibでフォントの追加方法を解説しています。1
システムから日本語対応したフォントを引っ張ってきてもいいんですが、手持ちのマックにはttfフォントが見当たらなかったので、IPAフォントを頂きました。
ダウンロードしたzipファイルを解凍し、以下のようにコピーします。コピー先は環境に依るのでご注意を。
$ cp ~/Downloads/IPAfont00303/*.ttf /usr/local/lib/python3.4/site-packages/matplotlib/mpl-data/fonts/ttf/
設定ファイルをホーム下にコピーして、それを編集します。
$ cp /usr/local/lib/python3.4/site-packages/matplotlib/mpl-data/matplotlibrc ~/.matplotlib/
$ vi ~/.matplotlib/matplotlibrc
font.familyにフォント名を設定します。
ここで指定するのはフォントファイル名ではないのでご注意を。
open ipa.ttfのようにして、使いたいフォント名を確認してから設定してください。
# The font.size property is the default font size for text, given in pts.
# 12pt is the standard value.
#
font.family         : IPAmincho
キャッシュデータを削除します。
$ rm ~/.matplotlib/fontList.py3k.cache
これで、次回import matplotlibした時に、キャッシュデータが自動的に生成され、日本語表示が可能になります。
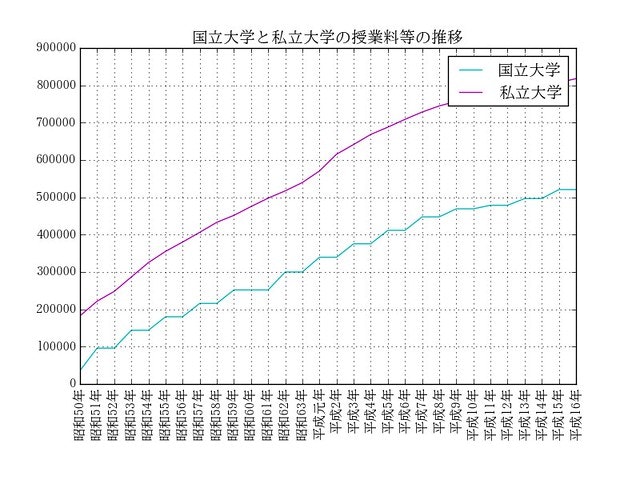
先ほどのpythonスクリプトを再実行すると、以下のように豆腐が解消されているのがわかります。
-
matplotlib標準のフォントが美しくない!とご立腹の様子 ↩

