目的
D3.jsで小学生の娘&息子とお絵描きしながらその過程で作成したモノをアップしました。
データを修正しながら、座標や配列について学習してもらいました。
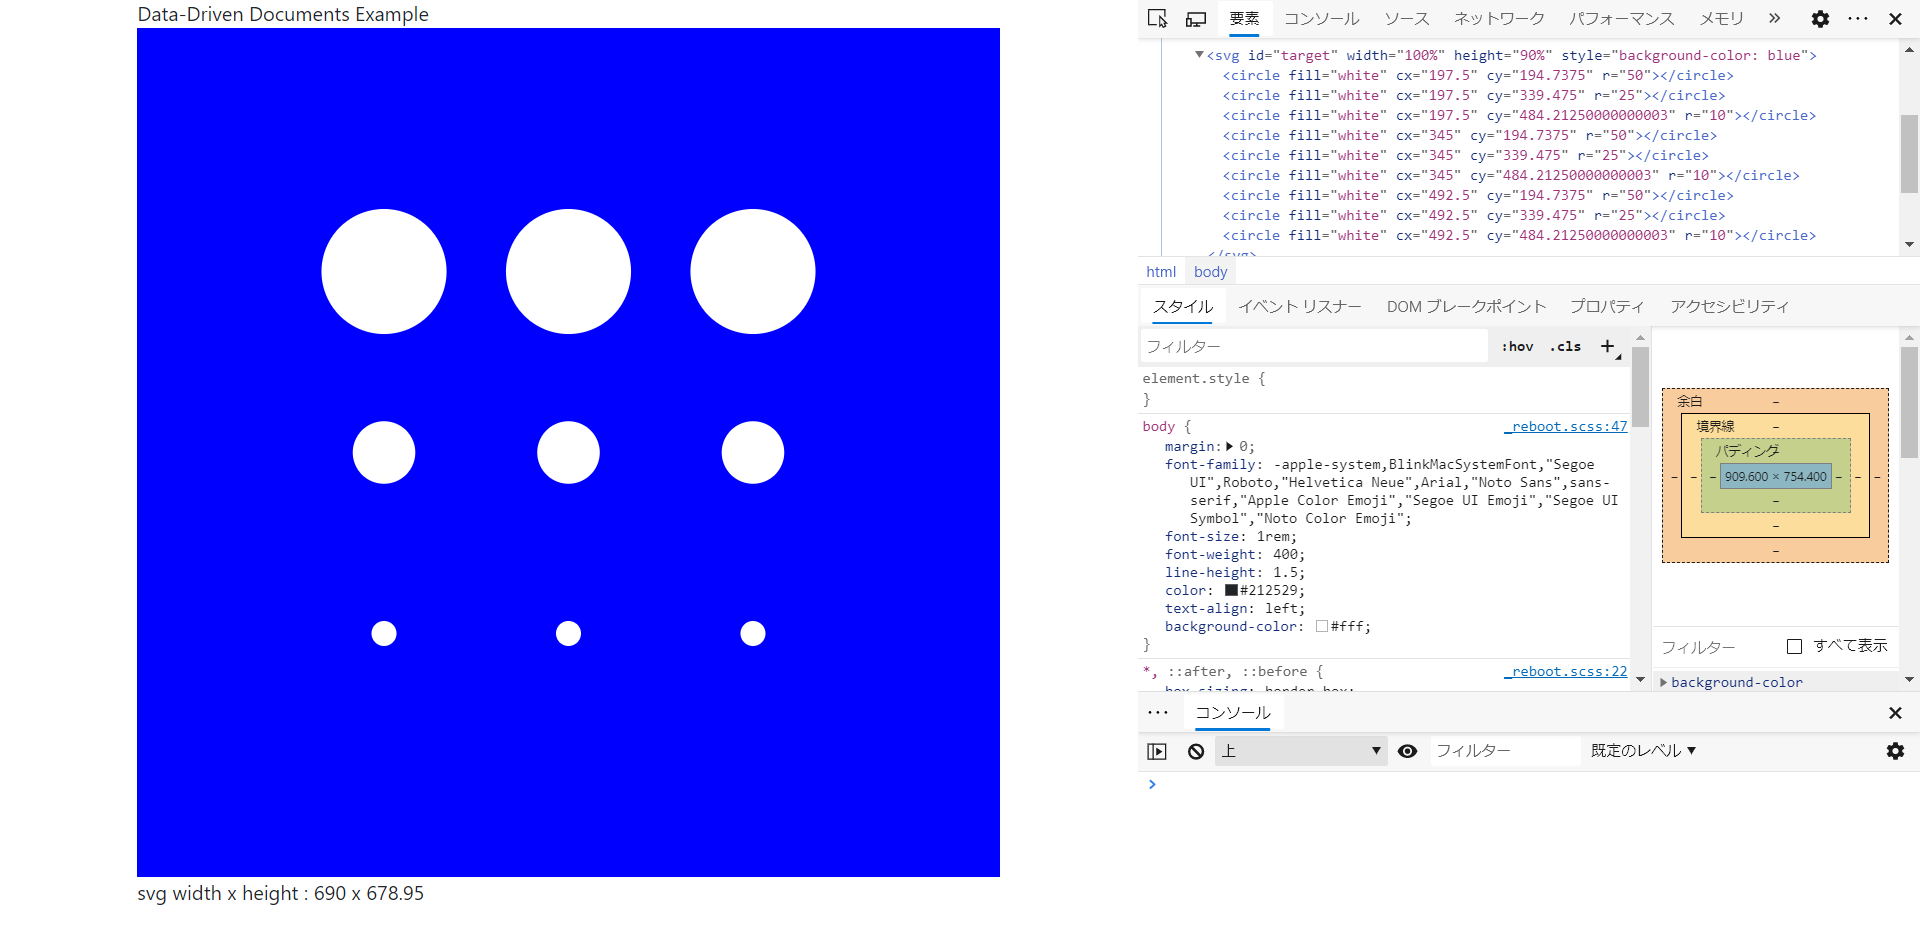
円を描く
<!DOCTYPE html>
<html>

<head>
    <meta http-equiv="Content-Type" content="text/html;charset=utf-8" />
    <meta charset="utf-8">
    <meta name="viewport" content="width=device-width, initial-scale=1, shrink-to-fit=no">
    <title>D3.js example</title>
    <link rel="stylesheet" href="https://stackpath.bootstrapcdn.com/bootstrap/4.5.0/css/bootstrap.min.css">
    <script src="https://d3js.org/d3.v5.min.js"></script>
    <script src="https://code.jquery.com/jquery-3.5.1.slim.min.js"></script>
    <script src="https://cdn.jsdelivr.net/npm/popper.js@1.16.0/dist/umd/popper.min.js"></script>
    <script src="https://stackpath.bootstrapcdn.com/bootstrap/4.5.0/js/bootstrap.min.js"></script>
</head>

<body>
    <div class="container vh-100">
        Data-Driven Documents Example
        <svg id="target" width="100%" height="90%" style="background-color: blue"></svg>
    </div>
</body>
<script>
    var svg = d3.select("#target");

    var w = $("#target").width();
    var h = $("#target").height();

    d3.select("div").append("p").text("svg width x height : " + w + " x " + h);

    // 入力データは[x座標、y座標、値(円の大きさ)]
    const dataset = [
        [1, 1, 50], [1, 2, 25], [1, 3, 10], [2, 1, 50], [2, 2, 25], [2, 3, 10], [3, 1, 50], [3, 2, 25], [3, 3, 10]
    ];

    // 入力ドメインと出力レンジをマッピングさせたスケール関数を定義
    // padding の分だけレンジを狭める
    const padding = d3.max(dataset, function (d) { return d[2]; });

    const xScale = d3.scaleLinear()
        .domain([0, d3.max(dataset, function (d) { return d[0] + 1; })])
        .range([padding, w - padding]);

    const yScale = d3.scaleLinear()
        .domain([0, d3.max(dataset, function (d) { return d[1] + 1; })])
        .range([padding, h - padding]);

    // 円を描画
    svg.selectAll("circle")
        .data(dataset)
        .enter()
        .append("circle")
        .attr("fill", "white")
        .attr("cx", function (d) {
            return xScale(d[0]);
        })
        .attr("cy", function (d) {
            return yScale(d[1]);
        })
        .attr("r", function (d) {
            return d[2];
        });
</script>
</html>
アニメーションを追加する
円がモワッと大きくなります。
delay()で指定した時間が経過した後、duration()で指定した時間をかけて指定の値へ変化します。
例では500ミリ秒後にアニメーションが開始し、1,000ミリ秒後に円の大きさが指定の大きさへ変化します。
    // 円を描画 - アニメーション付き
    var circles = svg.selectAll("circle")
        .data(dataset)
        .enter()
        .append("circle")
        .attr("fill", "white")
        .attr("cx", function (d) {
            return xScale(d[0]);
        })
        .attr("cy", function (d) {
            return yScale(d[1]);
        })
        .attr("r", 5)
        .transition().delay(500).duration(1000)
        .attr("r", function (d) {
            return d[2];
        });
線を引く
SVG の Line 要素で8本の線を描画しています。
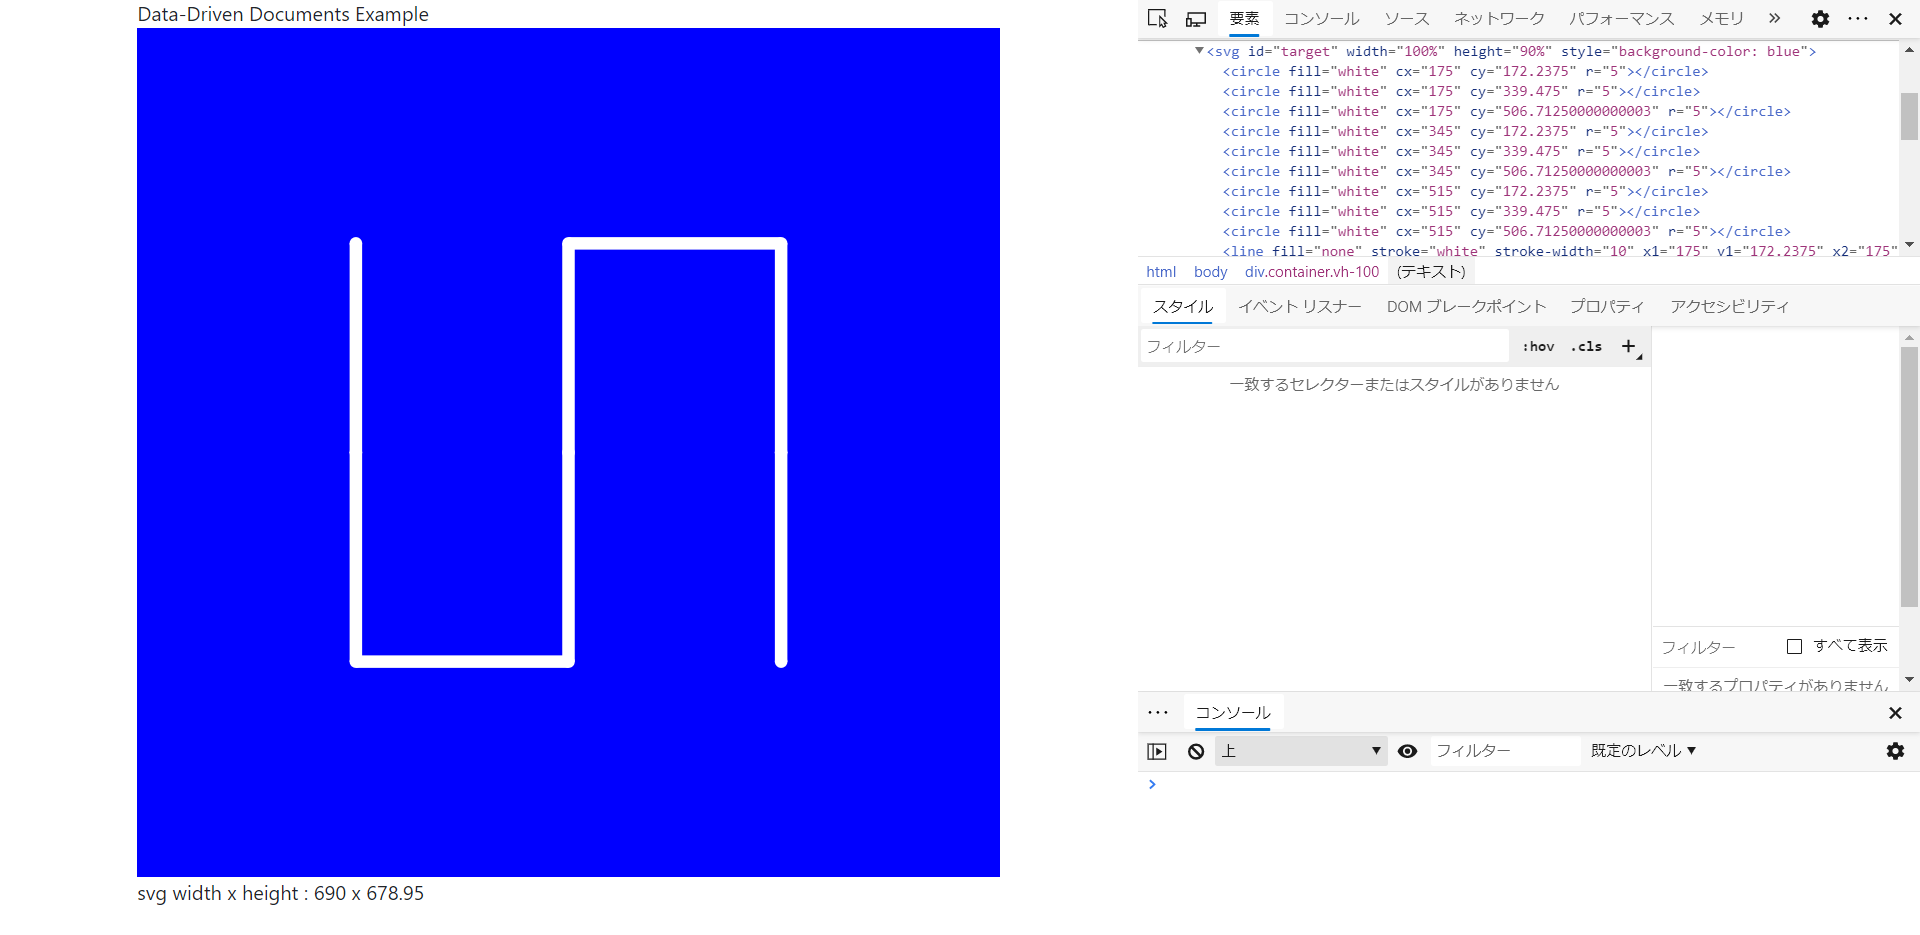
    // 線の入力データは始点と終点の座標
    const dataset2 = [
        [1, 1, 1, 2], [1, 2, 1, 3], [1, 3, 2, 3], [2, 3, 2, 2], [2, 2, 2, 1], [2, 1, 3, 1], [3, 1, 3, 2], [3, 2, 3, 3]
    ];

    // 線を描画
    svg.selectAll("line")
        .data(dataset2)
        .enter()
        .append("line")
        .attr("fill", "none")
        .attr("stroke", "white")
        .attr("stroke-width", 10)
        .attr("x1", function (d) {
            return xScale(d[0]);
        })
        .attr("y1", function (d) {
            return yScale(d[1]);
        })
        .attr("x2", function (d) {
            return xScale(d[2]);
        })
        .attr("y2", function (d) {
            return yScale(d[3]);
        })
        ;
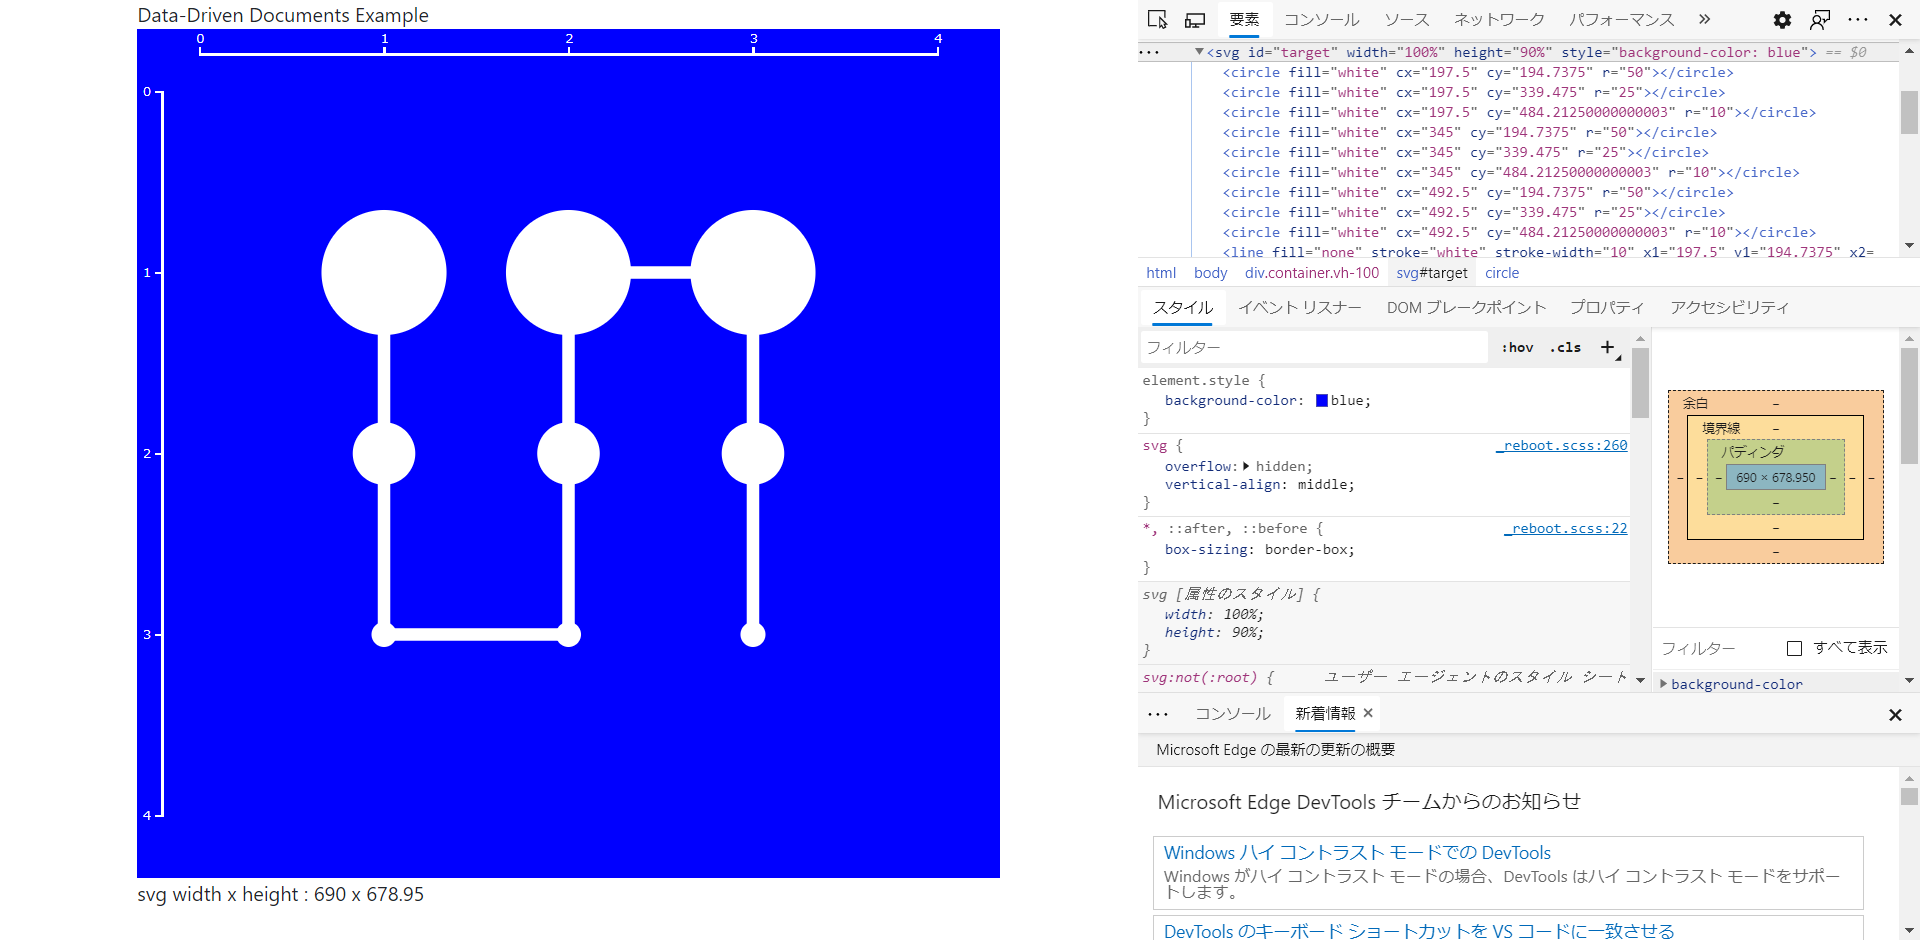
軸を追加する
座標が分かりにくいので、軸を追加します。
    // 軸の設定
    var xAxis = d3.axisTop(xScale).ticks(5);

    svg.append("g")
        .attr("class", "axis")
        .attr("transform", "translate(0,20)")
        .call(xAxis);

    var yAxis = d3.axisLeft(yScale).ticks(5);

    svg.append("g")
        .attr("class", "axis")
        .attr("transform", "translate(20,0)")
        .call(yAxis);
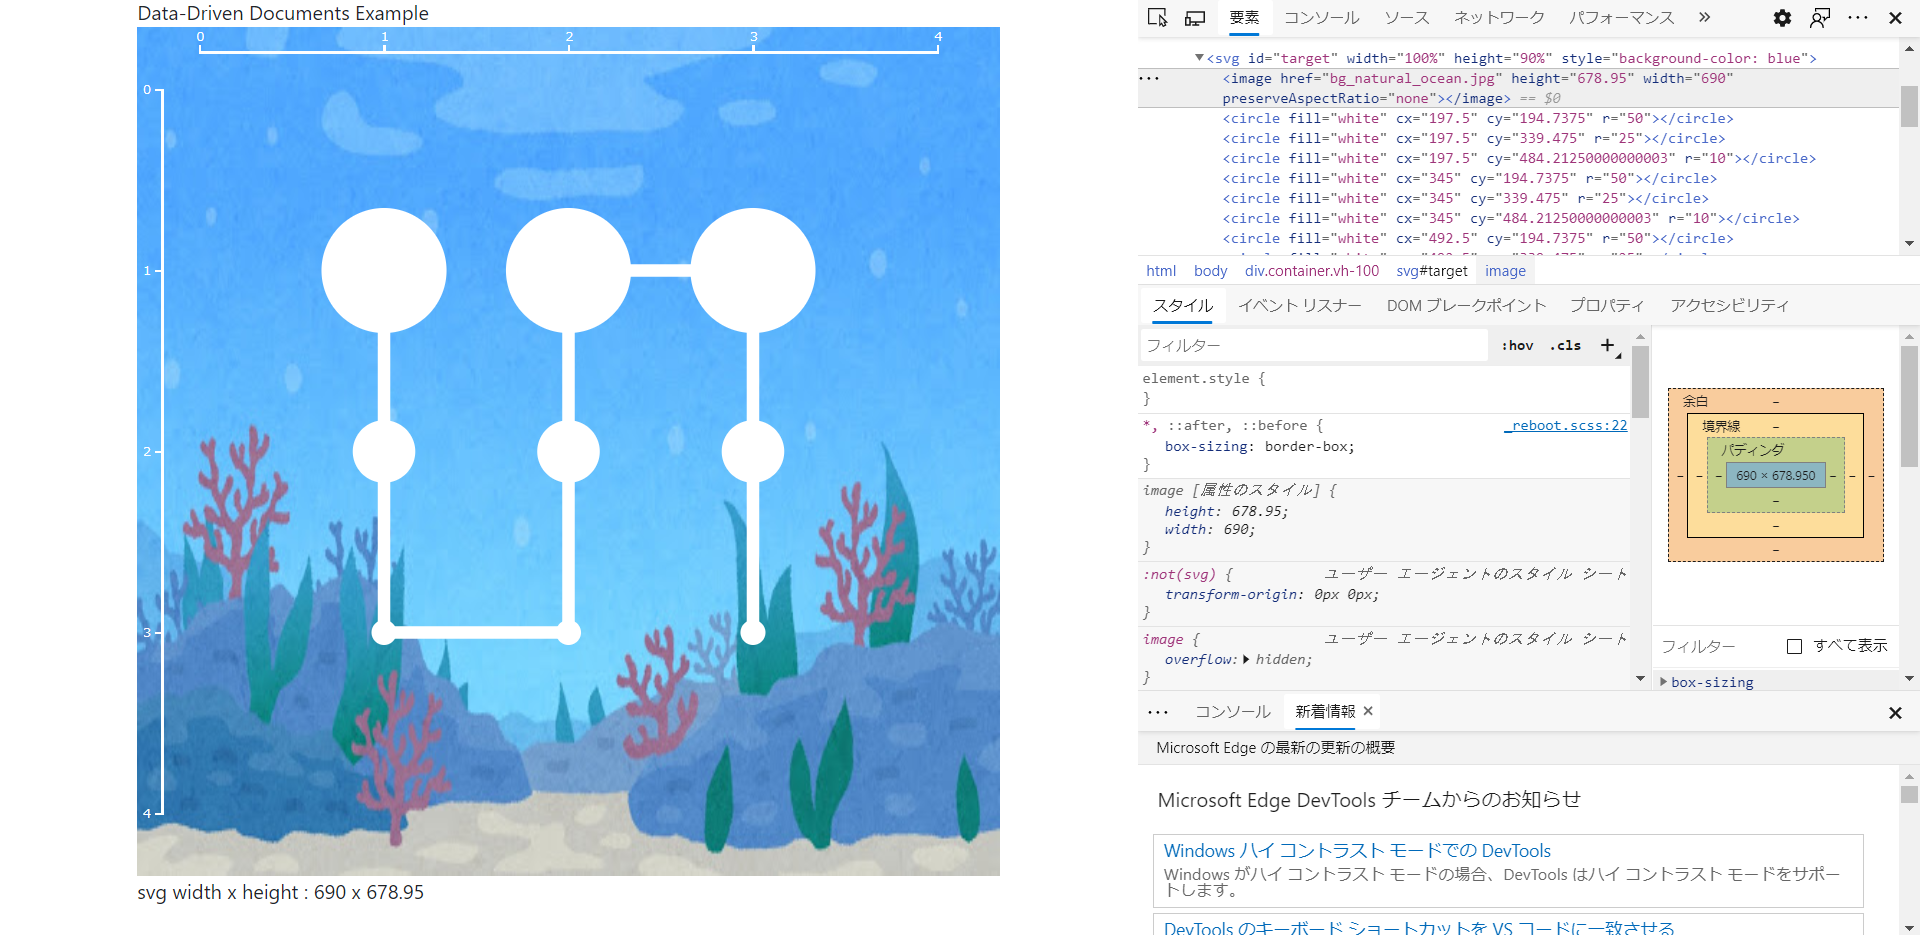
背景画像を追加する
味気ないので背景画像を追加します。
背景は一番最初に描画して、その上に円や線、軸を重ねていきます。
.attr('preserveAspectRatio', 'none')でSVGのサイズに画像をストレッチしています。
(画像は鉄板の「いらすとや」様からお借りしました)
    var images = svg
        .append('image')
        .attr('xlink:href', 'bg_natural_ocean.jpg')
        .attr('height', h)
        .attr('width', w)
        .attr('preserveAspectRatio', 'none');
ツールチップ表示(円の中に値を描画)
円にマウスオーバーすると表示し、背景画像にマウスオーバーすると非表示になるように設定しました。
背景、円、テキストの順番に描画します。
    // 背景にマウスオーバーイベントを追加
    var images = svg
        .append('image')
        .attr('xlink:href', 'bg_natural_ocean.jpg')
        .attr('height', h)
        .attr('width', w)
        .attr('preserveAspectRatio', 'none')
        .on("mouseover", function (d) {
            tooltip.attr("visibility", "hidden")
        })
        ;

    // 円にマウスオーバーイベントを追加
    var circles = svg.append("g")
        .selectAll("circle")
        .data(dataset)
        .enter()
        .append("circle")
        .attr("fill", "white")
        .attr("cx", function (d) {
            return xScale(d[0]);
        })
        .attr("cy", function (d) {
            return yScale(d[1]);
        })
        .attr("r", 10)
        .on("mouseover", function (d) {
            tooltip
                .attr("visibility", "visible")
                .attr("x", xScale(d[0]))
                .attr("y", yScale(d[1]))
                .attr("font-size", yScale(d[2]) / 10)
                .text(d[0] + " : " + d[1]);
        })
        .transition().delay(1000).duration(2000)
        .attr("r", function (d) {
            return yScale(d[2]) / 10;
        })
        ;

    //ツールチップを作成
    var tooltip = svg.append("text")
        .attr("text-anchor", "middle")
        .attr("dominant-baseline", "central")
        .attr("fill", "red")
        .attr("visibility", "hidden");
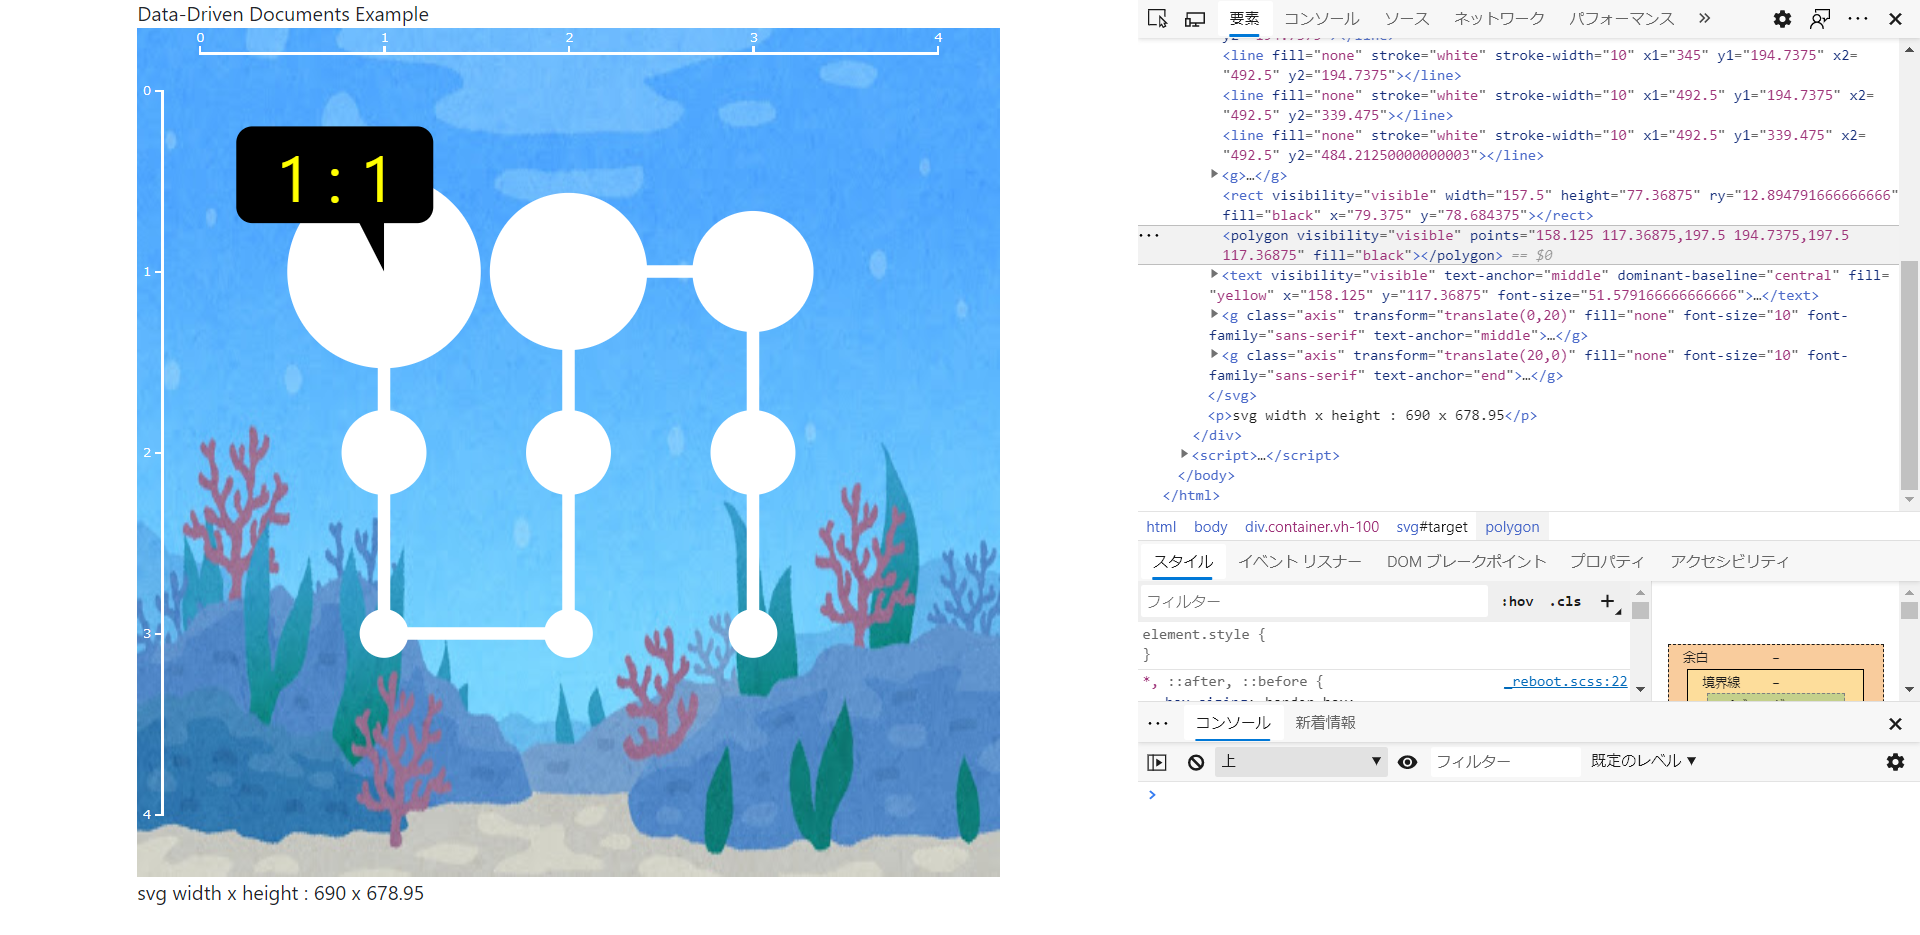
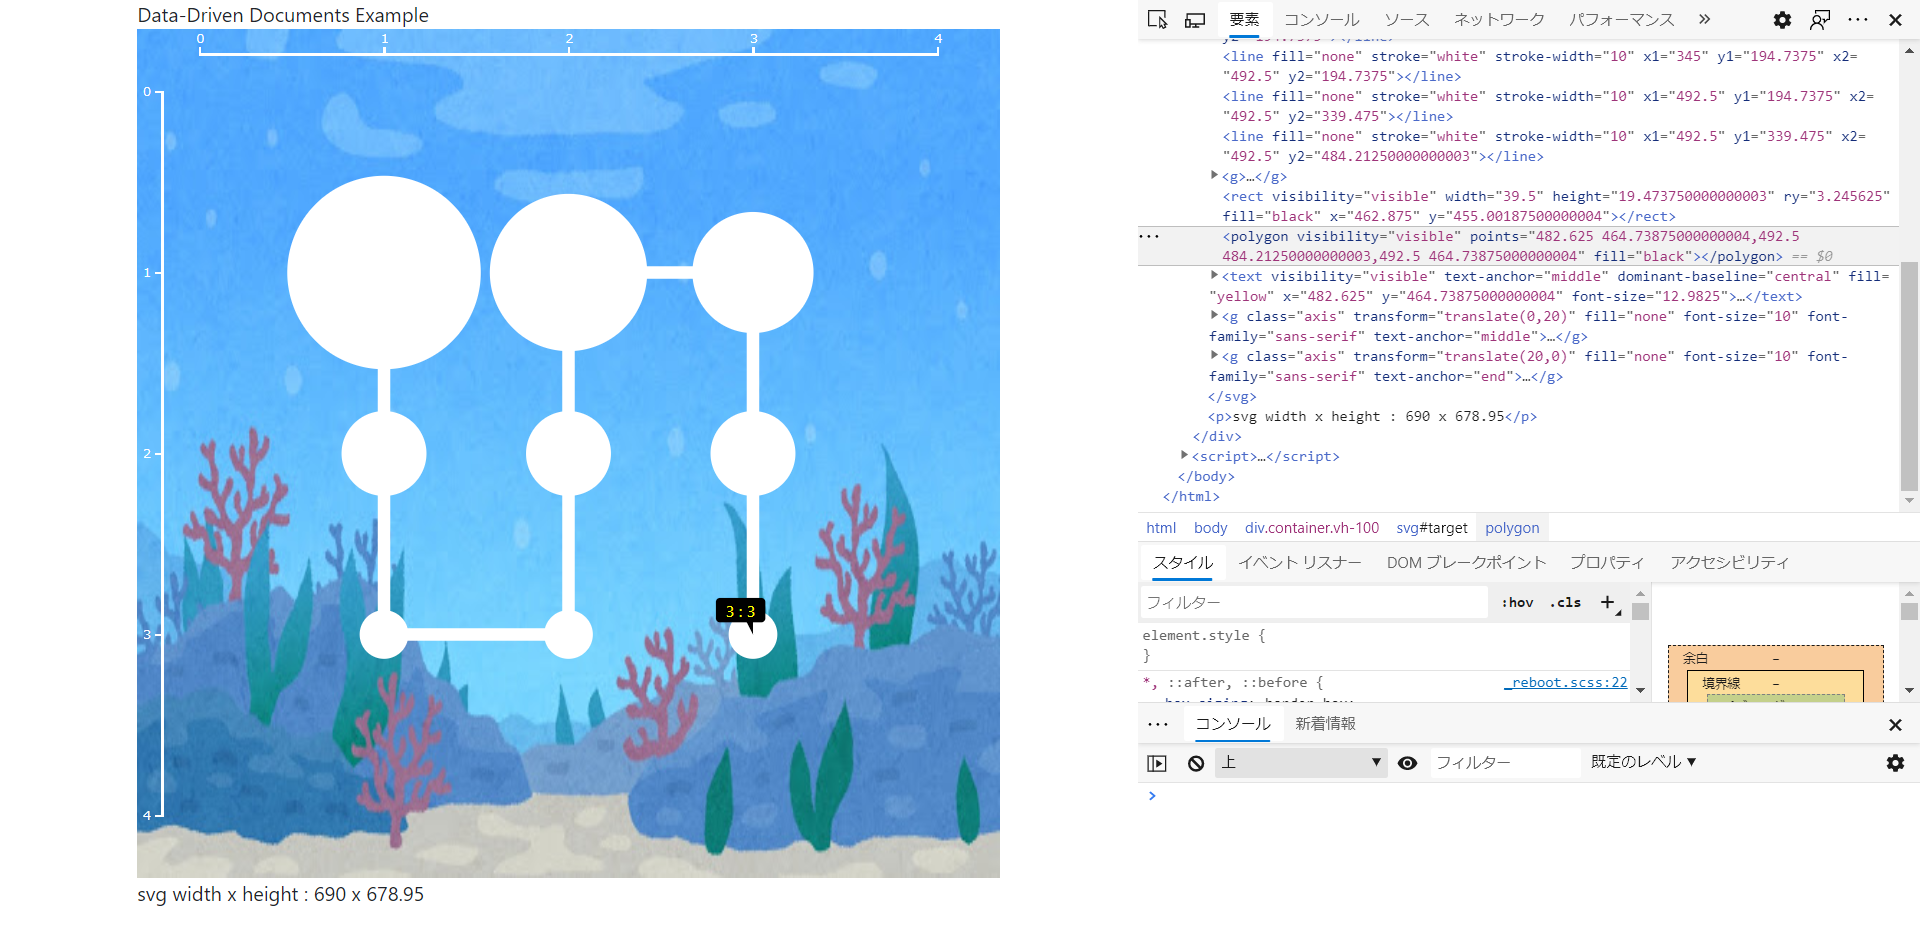
ツールチップを吹き出しにする
長方形rectと多角形polygonを組合せて吹き出しを作ります。
円の半径に応じて吹き出しのサイズも変わります。
    // 背景にマウスオーバーイベントを追加
    var images = svg
        .append('image')
        .attr('xlink:href', 'bg_natural_ocean.jpg')
        .attr('height', h)
        .attr('width', w)
        .attr('preserveAspectRatio', 'none')
        .on("mouseover", function (d) {
            balloon.attr("visibility", "hidden");
            tooltip.attr("visibility", "hidden");
            triangle.attr("visibility", "hidden");
        })
        ;

    // 円にマウスオーバーイベントを追加
    var circles = svg.append("g")
        .selectAll("circle")
        .data(dataset)
        .enter()
        .append("circle")
        .attr("fill", "white")
        .attr("cx", function (d) {
            return xScale(d[0]);
        })
        .attr("cy", function (d) {
            return yScale(d[1]);
        })
        .attr("r", 10)
        .on("mouseover", function (d) {
            balloon
                .attr("visibility", "visible")
                .attr("width", xScale(d[2]) / 5)
                .attr("height", yScale(d[2]) / 10)
                .attr("ry", yScale(d[2]) / 60)
                .attr("x", xScale(d[0]) - (xScale(d[2]) / 10 * 1.5))
                .attr("y", yScale(d[1]) - (yScale(d[2]) / 10 * 1.5))
                ;

            tooltip
                .attr("visibility", "visible")
                .attr("x", xScale(d[0]) - (xScale(d[2]) / 10 / 2))
                .attr("y", yScale(d[1]) - (yScale(d[2]) / 10))
                .attr("font-size", yScale(d[2]) / 15)
                .text(d[0] + " : " + d[1])
                ;

            triangle
                .attr("visibility", "visible")
                .attr("points",
                    String(xScale(d[0]) - (xScale(d[2]) / 10 / 2)) + " " +
                    String(yScale(d[1]) - (yScale(d[2]) / 10)) + "," +
                    String(xScale(d[0])) + " " +
                    String(yScale(d[1])) + "," +
                    String(xScale(d[0])) + " " +
                    String(yScale(d[1]) - (yScale(d[2]) / 10)))
                ;

        })
        .transition().delay(1000).duration(2000)
        .attr("r", function (d) {
            return yScale(d[2]) / 10;
        })
        ;

    //ツールチップを作成
    var balloon = svg.append("rect")
        .attr("visibility", "hidden")
        .attr("width", 100)
        .attr("height", 100)
        .attr("ry", 10)
        .attr("fill", "black")
        ;

    var triangle = svg.append("polygon")
        .attr("visibility", "hidden")
        .attr("points", "0 0" + "," + "50 50" + "," + "100 0")
        .attr("fill", "black")
        ;

    var tooltip = svg.append("text")
        .attr("visibility", "hidden")
        .attr("text-anchor", "middle")
        .attr("dominant-baseline", "central")
        .attr("fill", "yellow")
        ;