デジタル画像処理 という本で勉強中です。
理解を深める目的で(画素ごとの濃淡変換)の章でできる範囲で実装しました。
明るさのコントラストの変換
コントラストとは明るさや色などの移り変わり具合である。 (個人的な解釈)
コントラストが強い → 明るさや色の写り代わりがわかり易い、物の輪郭がわかり易い。
コントラストが弱い → 明るさや色の写り代わりがわかり難い、物の輪郭がわかり難い。
トーンカーブ
入力と出力の関係を変えることで、画像の色調(トーン)を変えることができる。
よって見え易くなったり、難くなったりする。
今回使う1枚目
効果を実感しやすいように、以下の写真のような暗めのサンプルを使う。
特徴:かなり暗い
# 必要なライブラリ
import cv2
import numpy as np
import matplotlib.pyplot as plt

# 写真のパス
pic_path = 'pet-bottle-pic/test/camera_pic/aquari3.jpg'

# 読みこみ
pic_image = cv2.imread(pic_path)

# グレーに変換
pic_image = cv2.cvtColor(pic_image, cv2.COLOR_BGR2GRAY)

# cvで読み込んだ場合、plt.imshowを使う場合はcmap='gray'を指定しないとグレーにならないので注意
plt.imshow(pic_image, cmap='gray')
plt.title('sample_dark')
plt.savefig("aquari_dark.jpg")
↓暗くてほとんど見えない
# 画素
pic_image.shape # (2464, 3280)
画素値の分布状況
# ヒストグラムにするために1次元に平す
flat_data = np.ravel(pic_image)

# 棒のスパン
bins_range = range(0, 260, 5)

# ヒストグラムを出力
plt.hist(flat_data, bins = bins_range)
plt.title('sample_dark')
plt.xlabel('pixel_value')
plt.ylabel('frequency')
plt.savefig("hist_aquari_dark.png")
↓黒側に偏りがある。
コントラスト変換の実装
折れ線型
作り方によっては任意の範囲のコントラストを強くすることができる。
(若干不自然さがあるが)
サンプル画像は画素値0~50の範囲に密集しているため、その範囲で角度をつけるようにした。
def bend_line(X):
    y = X*5
    y = np.where(y>=255, 255, y)
    return y
以下のグラフのような出力をする関数を適用する。
X = np.arange(0, 255, 1)
y = bend_line(X)

plt.title('sample_dark_bend_line')
plt.xlabel('INPUT')
plt.ylabel('OUTPUT')
plt.plot(X, y)
plt.savefig("bend_line.png")
適用あとの写真
pic_func1 = bend_line(pic_image)
plt.imshow(pic_func1, cmap='gray')
plt.title('sample_dark_after_bend_line')
plt.savefig("aquari_dark_after_bend_line.jpg")
↓ペットボトルが見えるようになった。(若干写りかたが汚いが)
分布を見てみる。
flat_data = np.ravel(pic_func1)

bins_range = range(0, 260, 5)

# ヒストグラムを出力
plt.hist(flat_data, bins = bins_range)
plt.title('sample_dark_after_bend_line')
plt.xlabel('pixel_value')
plt.ylabel('frequency')
plt.savefig("hist_aquari_dark_after_bend_line.png")
↓分布が少しならされた。
累乗型トーンカーブ(ガンマ補正)
暗すぎたり、明るすぎたりしてよくわからない画像の補正に適する。
端っこに分布が寄った画像のコントラストをあげるのに適する。
以下のガンマ関数と呼ばれる式を実装する。
$$
y = \left( \frac{X}{255} \right)^\frac{1}{\gamma} \times 255\
$$
ちなみにOpencv公式サイトでは1/γのところがγとして紹介されている。
def g_function(X, gamma):
    y = 255*(X/255)**(1/gamma)
    return y
それぞれのγ値に対するグラフ
X = np.arange(0, 255, 1)
gamma = [3, 2, 1.5, 1, 0.5, 0.33]
labels = ["3", "2", "1.5", "1", "0.5", "0.33"]

plt.title('g_function')
plt.xlabel('INPUT')
plt.ylabel('OUTPUT')

for g, l in zip(gamma, labels):
    y = g_function(X, g)
    plt.plot(X, y, label = l)
plt.legend()


plt.savefig("g_function.png")
γが大きい→ 全体的に暗い画像のコントラストを強くする。
γが小さい → 全体的に明るい画像のコントラストを強くする。
gamma = 3
pic_gfunc = g_function(pic_image, gamma)
plt.imshow(pic_gfunc, cmap='gray')
plt.title('sample_dark_after_gfunc')
plt.savefig("aquari_dark_after_gfunc.jpg")
↓結構綺麗になっている。
flat_data = np.ravel(pic_gfunc)

bins_range = range(0, 260, 5)

# ヒストグラムを出力
plt.hist(flat_data, bins = bins_range)
plt.title('sample_dark_after_gfunc')
plt.xlabel('pixel_value')
plt.ylabel('frequency')
plt.savefig("hist_aquari_dark_after_gfunc.png")
↓同様に分布もならされている。
次に使う画像
特徴:普通
# 写真のパス
pic_path = 'pet-bottle-pic/test/camera_pic/aquari.jpg'

# 読みこみ
pic_image = cv2.imread(pic_path)

# グレーに変換
pic_image = cv2.cvtColor(pic_image, cv2.COLOR_BGR2GRAY)

# cvで読み込んだ場合、plt.imshowを使う場合はcmap='gray'を指定しないとグレーにならないので注意
plt.imshow(pic_image, cmap='gray')
plt.title('sample_normal')
plt.savefig("aquari.jpg")
画素値の分布状況
# ヒストグラムにするために1次元に平す
flat_data = np.ravel(pic_image)

# 棒のスパン
bins_range = range(0, 260, 5)

# ヒストグラムを出力
plt.hist(flat_data, bins = bins_range)
plt.title('sample_normal')
plt.xlabel('pixel_value')
plt.ylabel('frequency')
plt.savefig("hist_aquari.png")
エス字カーブ型
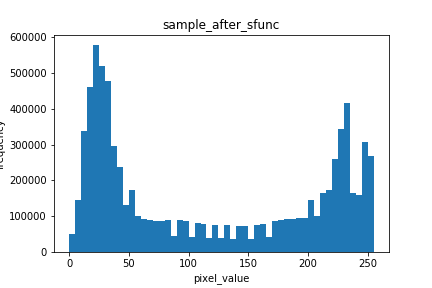
真ん中付近に分布が寄った画像のコントラストをあげるのに適する。
以下の式を実装する
$$
y = \frac{255}{1 + \exp^{a\left(-X + 127\right)}}\
$$
def s_func(X, a):
    y = 255/(1 + np.exp(a*(-1*X + 127)))
    return y
X = np.arange(0, 255, 1)
a = 0.05
y = s_func(X, a)

plt.title('s_function')
plt.xlabel('INPUT')
plt.ylabel('OUTPUT')

plt.plot(X, y)
plt.savefig("s_function.png")
a = 0.05
y = s_func(pic_image, a)
plt.imshow(y, cmap='gray')
plt.title('sample_after_sfunc')
plt.savefig("aquari_after_sfunc.jpg")
↓少しくっきりした。
flat_data = np.ravel(y)

bins_range = range(0, 260, 5)

# ヒストグラムを出力
plt.hist(flat_data, bins = bins_range)
plt.title('sample_after_sfunc')
plt.xlabel('pixel_value')
plt.ylabel('frequency')
plt.savefig("hist_aquari_sfunc.png")
↓ヒストグラムが平坦になった。
特殊な効果
使い道は謎な面もあるが実装してみた。
反転
明るい → 暗い
暗い → 明るい
になる。
def rev_func(X):
    y = -X + 255
    return y
X = np.arange(0, 255, 1)
y = rev_func(X)

plt.title('Rev_function')
plt.xlabel('INPUT')
plt.ylabel('OUTPUT')
plt.plot(X, y)
plt.savefig("rev_func.png")
y = rev_func(pic_image)
plt.imshow(y, cmap='gray')
plt.title('sample_after_rev_func')
plt.savefig("aquari_after_rev_func.jpg")
flat_data = np.ravel(y)

bins_range = range(0, 260, 5)

# ヒストグラムを出力
plt.hist(flat_data, bins = bins_range)
plt.title('sample_after_rev_func')
plt.xlabel('pixel_value')
plt.ylabel('frequency')
plt.savefig("hist_aquari_rev_func.png")
↓分布も左右で反転している。
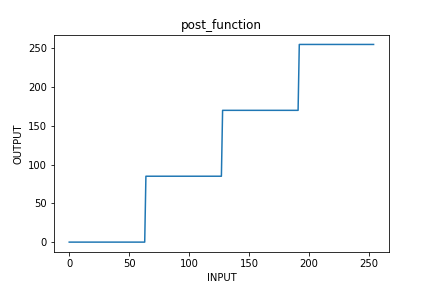
ポスタリゼーション
ポスターっぽくなる。
明るさを四段階に分けた
間隔:64
一段目:64
二段目:128
三段目:192
四段目:255
def post_func(X):
    y = np.where(X>=192, 255, X)
    y = np.where((y >=128 ) & (y < 192), 170, y)
    y = np.where((y >=64 ) & (y < 128), 85, y)
    y = np.where(y<64, 0, y)
    return y
X = np.arange(0, 255, 1)
y = post_func(X)

plt.title('post_function')
plt.xlabel('INPUT')
plt.ylabel('OUTPUT')
plt.plot(X, y)
plt.savefig("post_func.png")
y = post_func(pic_image)
plt.imshow(y, cmap='gray')
plt.title('sample_after_after_postfunc')
plt.savefig("aquari_after_postfunc.jpg")
↓ポスターっぽい
flat_data = np.ravel(y)

bins_range = range(0, 260, 5)

# ヒストグラムを出力
plt.hist(flat_data, bins = bins_range)
plt.title('sample_after_postfunc')
plt.xlabel('pixel_value')
plt.ylabel('frequency')
plt.savefig("hist_aquari_postfunc.png")
2値化
白黒はっきりする]
def to_func(X):
    y = np.where(X>=127, 255, X)
    y = np.where(y<127, 0, y)
    return y
X = np.arange(0, 255, 1)
y = to_func(X)

plt.title('2_function')
plt.xlabel('INPUT')
plt.ylabel('OUTPUT')
plt.plot(X, y)
plt.savefig("2_func.png")
y = to_func(pic_image)
plt.imshow(y, cmap='gray')
plt.title('sample_after_after_tofunc')
plt.savefig("aquari_after_tofunc.jpg")
↓逆に見えにくい?
flat_data = np.ravel(y)

bins_range = range(0, 260, 5)

# ヒストグラムを出力
plt.hist(flat_data, bins = bins_range)
plt.title('sample_after_totfunc')
plt.xlabel('pixel_value')
plt.ylabel('frequency')
plt.savefig("hist_aquari_tofunc.png")
↓2値化されている。
ソラリゼーション
写真の現像の時のフィルムみたいな感じになる。
from math import pi

def sora_func(X):
    X = (3*pi/255)*X
    y = -127.5*(np.cos(X))+127.5
    return y
X = np.arange(0, 255, 1)
y = sora_func(X)

plt.title('sora_function')
plt.xlabel('INPUT')
plt.ylabel('OUTPUT')
plt.plot(X, y)
plt.savefig("sora_func.png")
y = sora_func(pic_image)
plt.imshow(y, cmap='gray')
plt.title('sample_after_sorafunc')
plt.savefig("aquari_after_sorafunc.jpg")
↓なんとなくそれっぽい
flat_data = np.ravel(y)

bins_range = range(0, 260, 5)

# ヒストグラムを出力
plt.hist(flat_data, bins = bins_range)
plt.title('sample_after_soratfunc')
plt.xlabel('pixel_value')
plt.ylabel('frequency')
plt.savefig("hist_aquari_sorafunc.png")
複数の画像の利用
画像間演算と言われる、つまり複数の画像を混ぜ合わせる手法。
αブレンディング
それぞれに画像に対して重みをつけて混ぜると透けているような画像になる。
テレビの画面の移り変わりに使われているやつ
$$
g = af_1 + \left(1-a\right)f_2
$$
def blender(image_1, image_2, alpha):
    y = alpha*image_1 + (1 - alpha)*image_2
    return y

# 写真のパス
pic_path1 = 'pet-bottle-pic/test/template_pic/Aquarius.jpg'
pic_path2 = 'pet-bottle-pic/test/template_pic/Jasmin_tea.jpg'

# 読みこみ
image_1 = cv2.imread(pic_path1)
image_2 = cv2.imread(pic_path2)

alpha = 0.5

blended = blender(image_1, image_2, alpha)

cv2.imwrite('blended.jpg', blended)
エンボス
通常のグレー画像とネガポジ反転&わずかに平行移動した画像を足した後に、画素値を128引くことで生成される。
彫り込んだような絵になる。
$$
g = f_1 + f_2 - 128
$$
def rev_func(X):
    y = -X + 255
    return y

def enbos(image_1, image_2):
    y = image_1 + image_2 - 128
    return y


# グレーに変換
image_1 = cv2.cvtColor(image_1, cv2.COLOR_BGR2GRAY)

rows,cols = image_1.shape

# 加工する画像 (ネガポジ変換)
image_copy  = image_1.copy()
image_copy = rev_func(image_copy)

# 平行移動用の行列
mv_col, mv_row = 20, 0
M = np.float32([[1,0,mv_col],[0,1,mv_row]])

# 平行移動の実行
dst = cv2.warpAffine(image_copy,M,(cols,rows))

# エンボスの生成
img_e = enbos(image_1, dst)

cv2.imwrite('enbos.jpg', img_e)
image_data = image_1[1200]
dst_data = dst[1200]
enbos_data = img_e[1200]

plt.plot(image_data, label = 'normal_img')
plt.plot(dst_data, label = 'np_mv_img')
plt.plot(enbos_data, label = 'enbos_img')

plt.title('process of enbos')
plt.xlabel('pixel_value')
plt.ylabel('frequency')
plt.legend()
plt.savefig("enbos_fig.jpg")
↓オレンジと青を足して、緑が出来上がる。
以下のように緑のグラフのように、差分(平行移動でずれた部分)が強調される。
マスク処理
単純に1か0で任意の画素に違う画像を混ぜた処理
# # 読みこみ
# image_1 = cv2.imread(pic_path1)
# image_2 = cv2.imread(pic_path2)

get_from_image_1 = image_1[500 : 1800, 1000 : 2000]
masked_image = image_2.copy()
masked_image[500 : 1800, 1000 : 2000] = get_from_image_1
cv2.imwrite('masked.jpg', masked_image)
↓切り取って貼り付けた感じになる
終了


