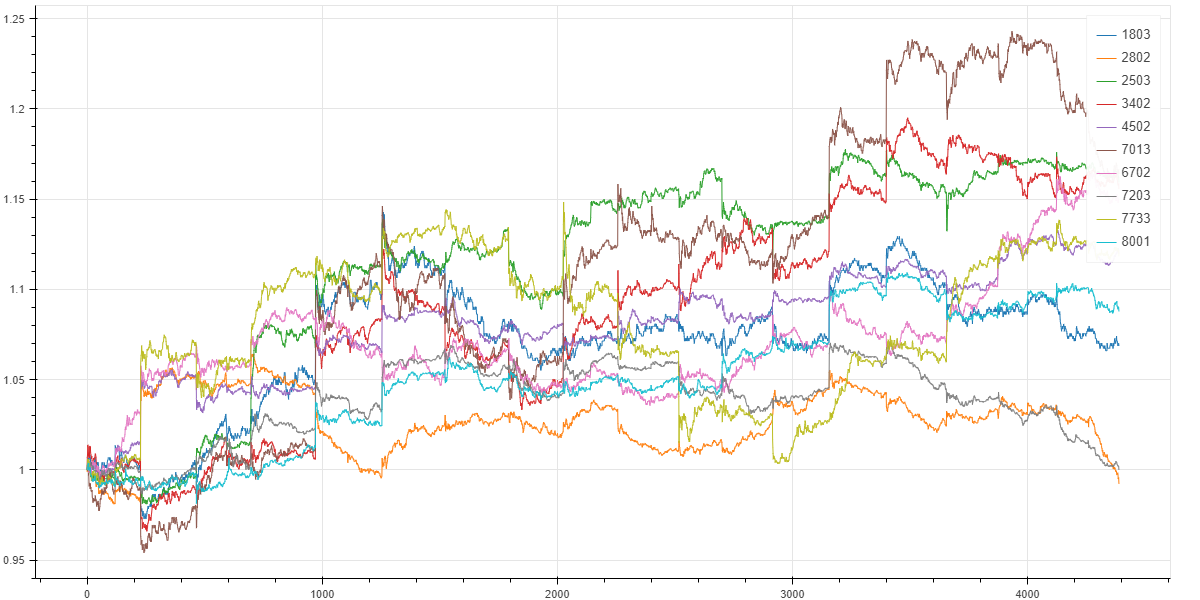
自分はPythonでのグラフ描画に,インタラクティプなグラフの保存ができ,ストリーミングデータも扱えるbokehを利用しています.今回はbokehでmatplotlibのデフォルトのラインカラー(に似た色)を使えるようにします.
import pandas as pd
import datetime
import matplotlib.pyplot as plt
import numpy as np
import bokeh.plotting
from bokeh.io import output_notebook, show
output_notebook()
from bokeh.palettes import d3
まず,可視化するデータとしてこちらの株価データを利用します.このデータは日経平均採用銘柄から選んだ10銘柄の2020年11月4日から2020年11月30日までの分足の始値です.
df = pd.read_csv("naive_multi_10.csv")
df
| 1803 | 2802 | 2503 | 3402 | 4502 | 7013 | 6702 | 7203 | 7733 | 8001 | |
|---|---|---|---|---|---|---|---|---|---|---|
| timestamp | ||||||||||
| 2020-11-04 09:06:00 | 742.0 | 2191.0 | 1957.5 | 498.200012 | 3329.0 | 1334.0 | 12575.0 | 7019.0 | 2018.0 | 2576.5 |
| 2020-11-04 09:07:00 | 744.0 | 2189.0 | 1957.5 | 501.700012 | 3332.0 | 1335.0 | 12595.0 | 7020.0 | 2023.5 | 2579.5 |
| 2020-11-04 09:08:00 | 744.0 | 2195.5 | 1958.5 | 502.600006 | 3332.0 | 1336.0 | 12575.0 | 7019.0 | 2027.5 | 2581.5 |
| 2020-11-04 09:09:00 | 745.0 | 2193.0 | 1957.5 | 505.100006 | 3332.0 | 1342.0 | 12575.0 | 7019.0 | 2030.0 | 2583.0 |
| 2020-11-04 09:10:00 | 746.0 | 2194.0 | 1956.5 | 504.700012 | 3339.0 | 1340.0 | 12590.0 | 7020.0 | 2026.5 | 2584.5 |
| ... | ... | ... | ... | ... | ... | ... | ... | ... | ... | ... |
| 2020-11-30 14:55:00 | 793.0 | 2186.0 | 2278.0 | 576.799988 | 3731.0 | 1553.0 | 14450.0 | 7033.0 | 2263.0 | 2806.0 |
| 2020-11-30 14:56:00 | 794.0 | 2180.0 | 2274.0 | 576.799988 | 3735.0 | 1554.0 | 14435.0 | 7034.0 | 2262.0 | 2809.5 |
| 2020-11-30 14:57:00 | 794.0 | 2181.5 | 2276.5 | 576.799988 | 3738.0 | 1555.0 | 14455.0 | 7035.0 | 2262.5 | 2809.0 |
| 2020-11-30 14:58:00 | 794.0 | 2181.5 | 2274.5 | 577.200012 | 3735.0 | 1556.0 | 14460.0 | 7033.0 | 2263.5 | 2808.5 |
| 2020-11-30 14:59:00 | 793.0 | 2174.5 | 2269.5 | 575.799988 | 3728.0 | 1553.0 | 14465.0 | 7019.0 | 2257.0 | 2803.0 |
4390 rows × 10 columns
matplotlibで描画
シンプルにmatplotlibで描画します.matplotlibはax.plotを呼ぶたびに自動で色が割り当てられます.明示したい場合はcolorを"C0","C1"のように指定します.
fig, ax = plt.subplots(figsize=(20,10))

for column_name in df.columns:
    x = np.arange(0,len(df.index))
    y = df.loc[:,column_name] / df.loc[df.index[0],column_name]
    ax.plot(x, y, label=column_name)

ax.legend()

bokehで描画
ここからが本題です.bokeh.palettesからd3をインポートします.d3はカラコードのリストからなる辞書であり,"Category10"や"Category20"などが利用できます.詳しくはこちらにあります.そのうち"Category10"が最もmatolotlibのデフォルトのラインカラーに近いため,これを利用します.
colors = d3["Category10"][10]

p = bokeh.plotting.figure(plot_width=1200,plot_height=600)

for i, column_name in enumerate(df.columns):
    x = np.arange(0,len(df.index))
    y = df.loc[:,column_name] / df.loc[df.index[0],column_name]
    p.line(x=x, y=y, line_color=colors[i], legend_label=column_name)

show(p)

まとめ
-
bokeh.palettes.d3の"Category10"のカラーコードのリストを利用することで,matplotlibのデフォルトのラインカラーを再現しました.