動機
- pythonでsemを行うモジュールが見つからない!
- きれいなsem図を自動で出力したい
- python上でRを使いたい
- 分析のかゆいところに手が届くのはR(の気がする)
-
R vs Python:データ解析を比較によると
- 統計以外のタスクを行う場合は、Pythonの方が単純である
- Rは一般的に、より統計をサポートしている
説 : pythonとRで補いあえば最強説
- pythonのモジュールである「pyper」を使用することでRとpythonの連携が可能
python上でのpyperの設定
-
pyperのインストール
pip install pyper -
pyperをインポートしpyperのインデントを作成
- 「RCMD=」でRのpathを指定する必要有(
//で) -
use_numpy='True', use_pandas='True'とすることでnumpy,pandas型のデータをRに読み込ませることが可能
- 「RCMD=」でRのpathを指定する必要有(
python
import pyper
import os
import numpy as np
import pandas as pd
# pyperのインデントを作成
r = pyper.R(RCMD="C:\\Program Files\\R\\R-3.2.5\\bin\\x64\\R", use_numpy='True', use_pandas='True')
Rでのsemプログラムファイル作成
- 当初Rの「sem」パッケージを使用していましたが、エラーが続出し「lavaan」に切り替えました(泣)
- lavaanの中のsem関数の方が設定が簡単でした。
- このファイルの作成は「はじめての共分散構造分析 Amosによるパス解析」をlavaanでやってみるを参考にさせて頂きました。
- Rには事前に使用するパッケージ「lavaan」,「semplot」をインストール済み
- この「semplot」を使うと「lavaan」の推定結果の図を簡単に出力してくれるみたいです。
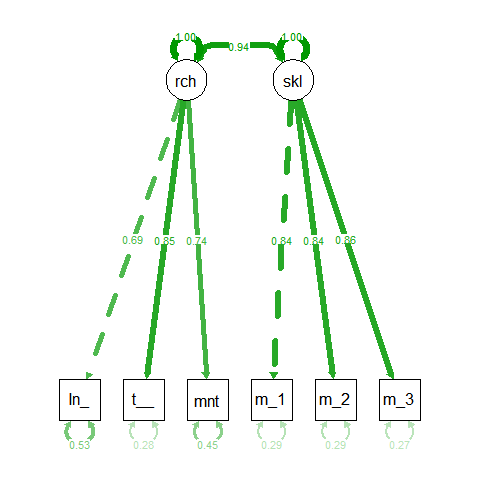
- このRのプログラムはSEMのモデルを作成、推定し、パス図を.pngで保存するものです。
R(lavaan.R)
library(lavaan)
library(semPlot)

r <-  cor(dat)

model1 <- ('
  reach=~a1*Intermediate_test+a2*term_end_exam+a3*minitest
  skill=~b1*mock_examination1+b2*mock_examination2+b3*mock_examination3
  reach~~skill
  ')

fit <- sem(model1, sample.cov=r, sample.nobs=284)


png("C:\\Users\\xxxxxxxx\\Documents\\Python Scripts\\python_R\\semplot.png")
semPaths(fit, "std", edge.label.cex = 1,line = 3, curvePivot = TRUE,
         sizeMan = 8, sizeInt = 1, sizeLat = 8)
dev.off()
pythonとRを連携させる
- pythonにデータを読み込ませる
- 今回はRを使った分析(SEM)
の
「書籍使用データ」を英語に変換して使わせて頂きました。
- 今回はRを使った分析(SEM)
python
test = pd.read_csv("C:\Users\xxxxxxx\Documents\R\input\data\ch14sem.csv")
- pythonのデータをRに渡す
- 「test」を「dat」としてRに渡します。
python
r.assign("dat", test)
- Rのファイルである「lavaan.R」をpythonで実行
python
r("source(file='C:\\Users\\xxxxx\\Documents\\R\\input\\script\\lavaan.R')")
-
r.get(" ")でR内のオブシェクトの抽出が可能
python(相関行列の抽出)
r.get("r")
-
r(" ")でpython上でRのコマンドをpython上で実行し、その結果を出力することが可能
python(推定結果表示)
print r("summary(fit, standardized=TRUE, fit.measure=TRUE)")
出力されたパス図##
このパス図はsemPlot Examples | - Sacha Epskampによると細かいところまで設定できるみたいです。(これでいちいちパワポやdraw.ioでパス図を描かなくてもよくなればいいな。。)
詰まったところ
- R上でインデントを整えないとR上でエラーが出なくてもpython上でエラーが出てしまう。
- R上でのplotはpythonに
r.get("")で持ってこれないが.pngは出力されていました。 - パスの指定に
//を使うこと。
参考にさせて頂いたサイト
Rを使った分析(SEM)
「はじめての共分散構造分析 Amosによるパス解析」をlavaanでやってみる
Python と R で連携する
PypeR
R vs Python:データ解析を比較
semPlot Examples | - Sacha Epskamp
