背景
モノの量的な流れを上手く表現したい場面に出くわした。
- あるサイトを訪れた人が、どのページにどれだけ遷移し、あるいは離脱していくかを観察したい。
- 家計(会社)の収支に関して『どの時点で』『何に』『どのくらい』という観点で観察したい、など。
このような場面でよく用いられるのが、Sankeyダイアグラムだ。
Sankeyダイアグラム

(図はWikipediaから)
サンキー・ダイアグラムは工程間の流量を表現する図表である。矢印の太さで流れの量を表している。特にエネルギーや物資、経費等の変位を表す為に使われる。
サンキ―ダイアグラム -Wikipedia
蒸気機関におけるエネルギー収支したのが始まりらしい。そして、その著者がM.H.Sankeyとのこと。
蒸気期間の例では、エネルギーが、どのように、どれくらい消費されるのか、また系を循環するのかが直感的に理解できる。
Pythonで描いてみたい
ipysankeywidgetというjupyter notebook上で動くwidgetが公開されている。ありがたい。
READMEに従って、一通りの準備を済ませた後で、
さっそくnotebookで動かしてみる。
from ipysankeywidget import SankeyWidget
notebook上で、sankeyダイアグラムを良い感じに描画してくれるように関数を用意する。
def sankey(width=300, margin_top=10, **value):
    return SankeyWidget(value=value, width=str(width), height=200,
                        margins=dict(top=margin_top, bottom=0, left=30, right=60))
使い方
基本的には、次の項目を辞書形式で描いてあげればよい。
- どこから: "source"
- どこへ:"target"
- どれくらい: "value"
links = [
    {'source': 'A', 'target': 'B', 'value': 1},
    {'source': 'B', 'target': 'C', 'value': .5},
    {'source': 'A', 'target': 'D', 'value': .5},
]
sankey(links=links)

上の例では、ノード”B”と”D”が揃えられているが、どのノードの位置を揃えるか、も変えられる。以下の例では、ノード"C"と"D"を揃えてみる。
rank_sets = [
    { 'type': 'same', 'nodes': ['C', 'D'] }
]
sankey(links=links, rankSets=rank_sets)

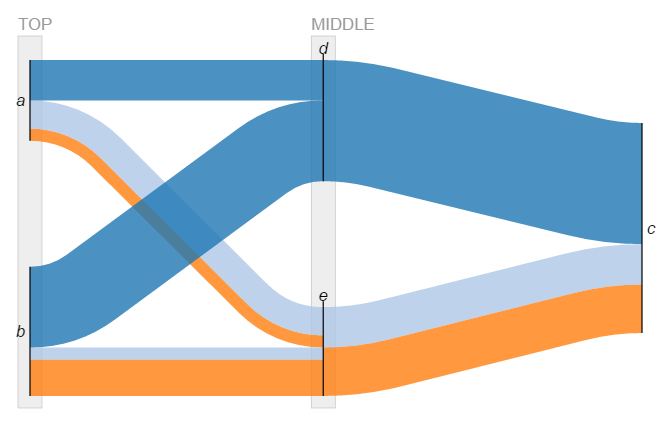
こんな感じで、色々設定できるので、ちょっと複雑にしてみたのが下図。
実データがあれば、適用してみたかった...。
今回は、ここまで。
# ノード情報
Ns= [
    {
      "id": "a",
      "title": "a"
    },
    {
      "id": "b",
      "title": "b"
    },
    {
      "id": "c",
      "title": "c"
    },
    {
      "id": "x",
      "title": "d"
    },
    {
      "id": "y",
      "title": "e"
    }
  ]

# リンク情報
Ls= [
    {
      "source": "a",
      "target": "x",
      "value": 1,
      "type": "x"
    },
    {
      "source": "a",
      "target": "y",
      "value": 0.7,
      "type": "y"
    },
    {
      "source": "a",
      "target": "y",
      "value": 0.3,
      "type": "z"
    },
    {
      "source": "b",
      "target": "x",
      "value": 2,
      "type": "x"
    },
    {
      "source": "b",
      "target": "y",
      "value": 0.3,
      "type": "y"
    },
    {
      "source": "b",
      "target": "y",
      "value": 0.9,
      "type": "z"
    },
    {
      "source": "x",
      "target": "c",
      "value": 3,
      "type": "x"
    },
    {
      "source": "y",
      "target": "c",
      "value": 1,
      "type": "y"
    },
    {
      "source": "y",
      "target": "c",
      "value": 1.2,
      "type": "z"
    }
  ]

# グループ情報
groups = [
    {'id': 'G1', 'title': 'TOP', 'nodes': ['a', 'b'] }
    ,{'id': 'G2', 'title': 'MIDDLE', 'nodes': ['x', 'y'] }
]

sankey(links=Ls, nodes=Ns, groups=groups, alignLinkTypes= False, margin_top=50)
参考URL
-
Water Programming: A Collaborative Research Blog
- TitanicのデータにSankeyを適用した例が紹介されています