はじめに
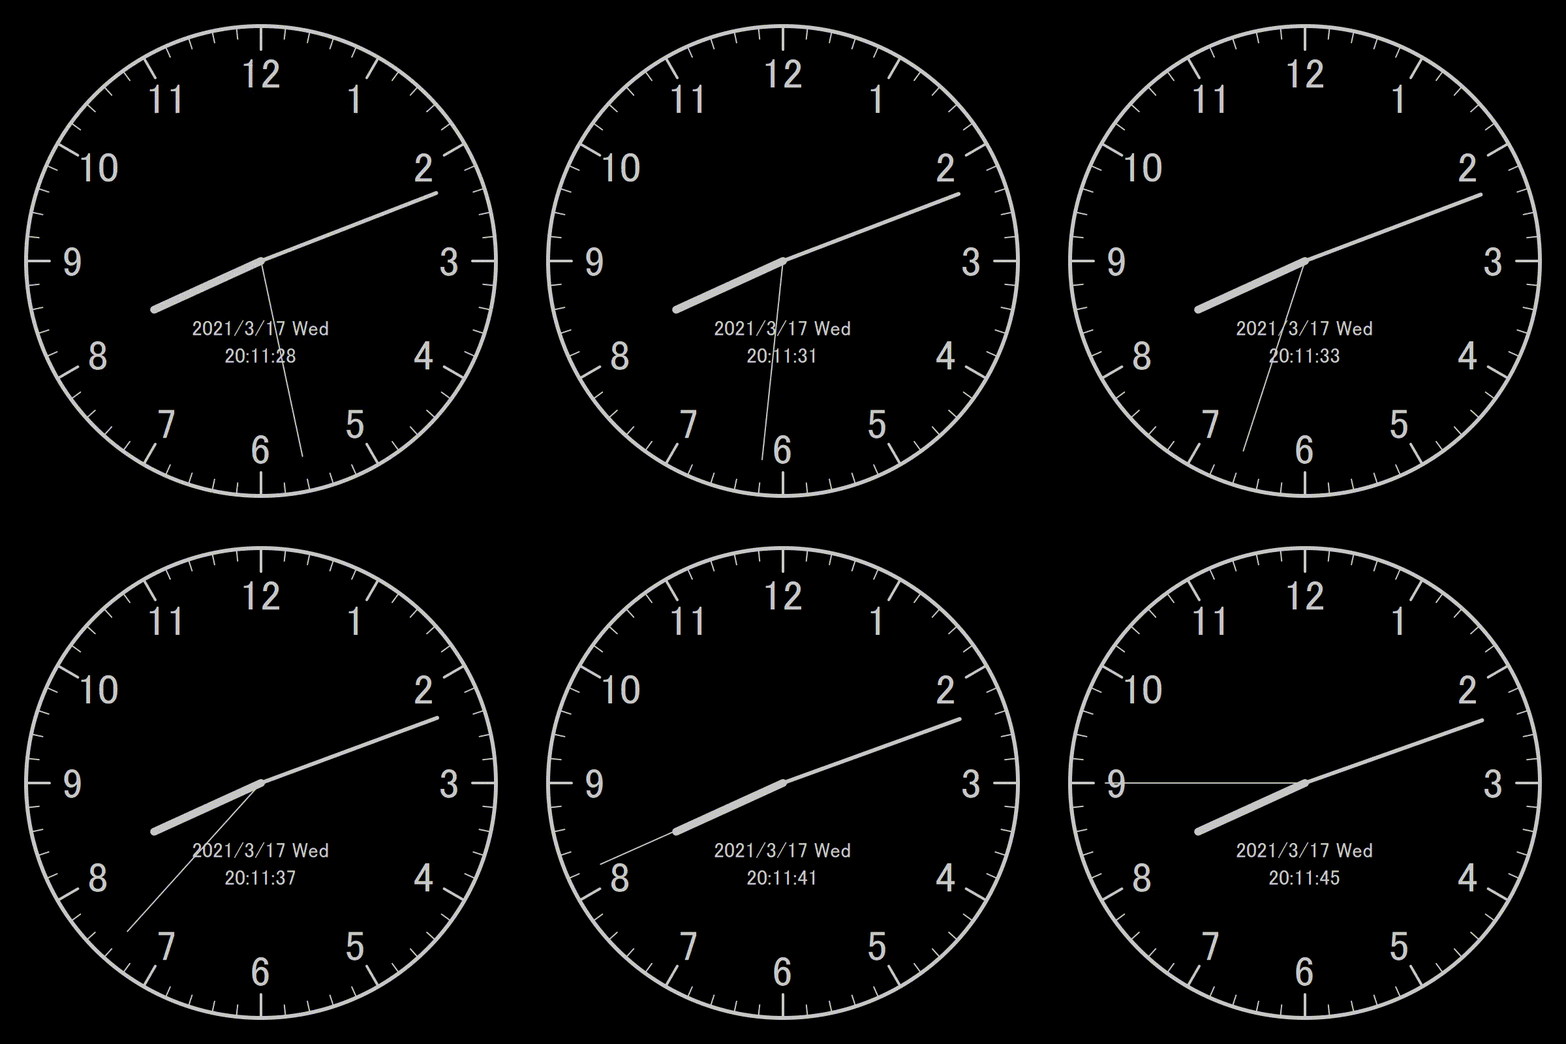
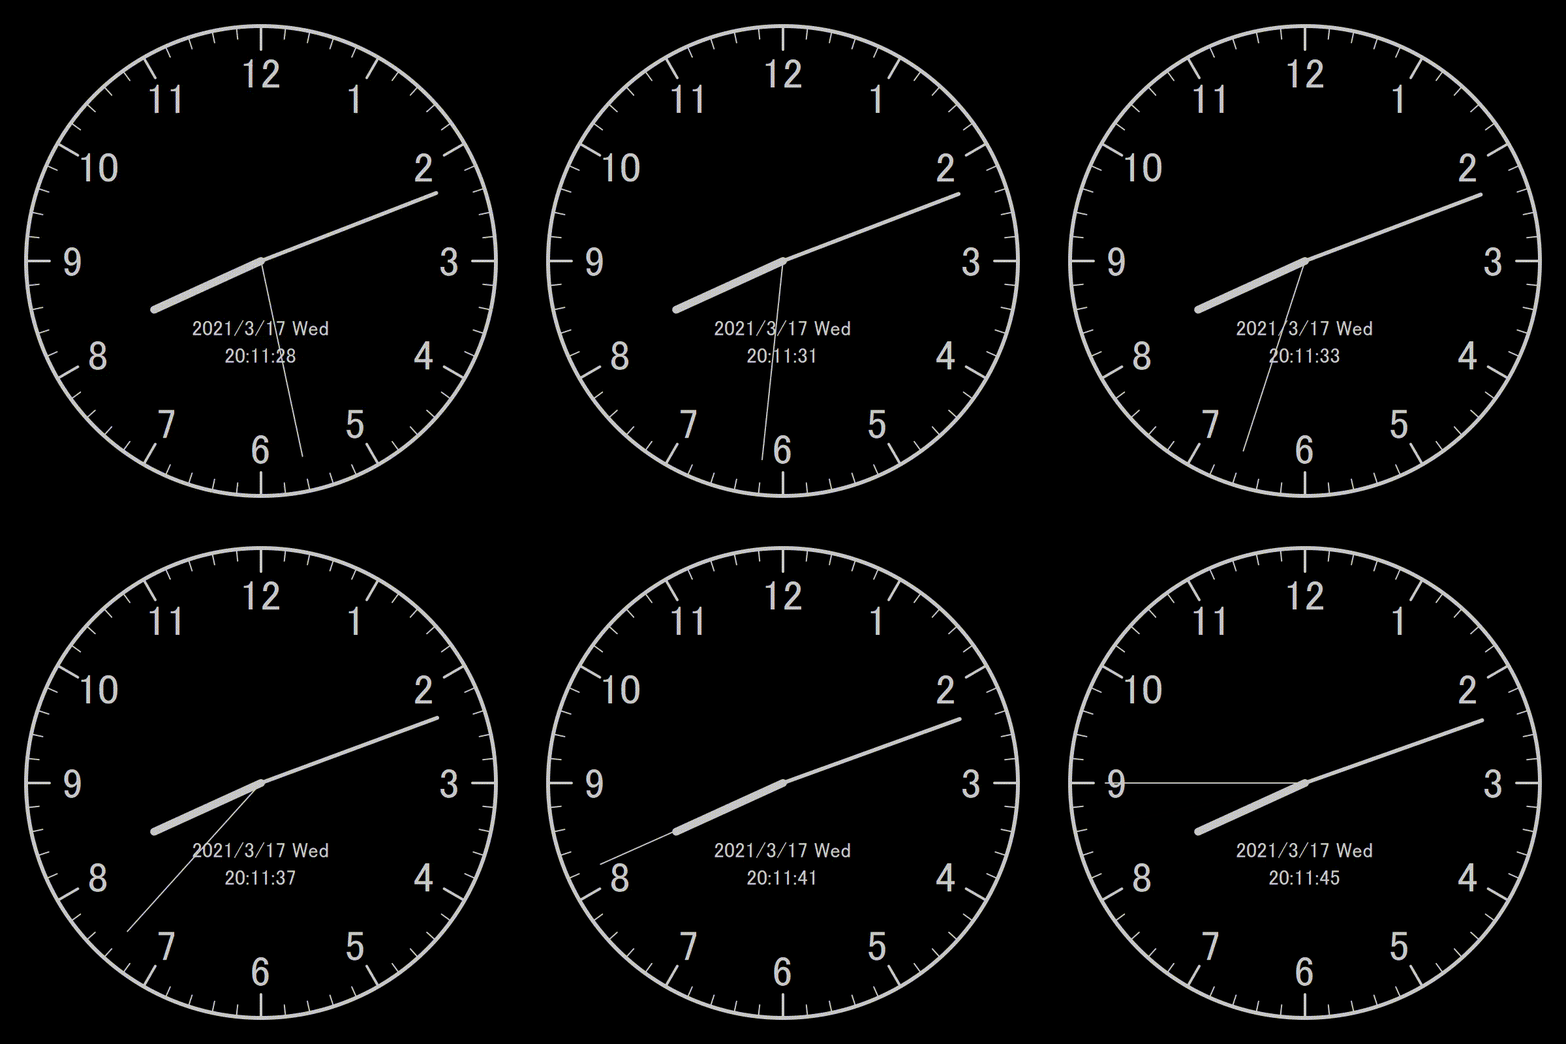
なぜか急にアナログ時計アプリが欲しくなったので衝動的に作りました。せっかく作ったので、作り方を紹介しようと思います。
言語はタイトルにある通りPythonです。
コード全体はgithubで公開しています。
https://github.com/ddside/analog_clock_python/blob/main/analog_clock.py
環境
- Python3.7
必要なモジュールのインストール
事前にpyqtgraphとnumpyをインストールします。
pip install pyqtgraph numpy
ウインドウを定義する
以下のコードを実行すると真っ黒なウインドウが表示されます。このウインドウにアナログ時計を描画していきます。
from pyqtgraph.Qt import QtGui, QtCore
import pyqtgraph as pg
import numpy as np
import datetime

win = pg.GraphicsLayoutWidget(show=True, title='Analog clock')
init_window_size = 800
win.resize(init_window_size, init_window_size)

pg.setConfigOptions(antialias=True)

if __name__ == '__main__':
    import sys

    app = QtGui.QApplication([])
    if (sys.flags.interactive != 1) or not hasattr(QtCore, 'PYQT_VERSION'):
        QtGui.QApplication.instance().exec_()
アナログ時計の枠となる円を描画する
graph = win.addPlot()
# 軸は非表示にする
graph.showAxis('bottom', False)
graph.showAxis('left', False)
# アスペクト比を固定する
graph.setAspectLocked(lock=True)
# マウスによる軸の移動を無効化する
graph.setMouseEnabled(x=False, y=False)

radius = 1

# 円を描画する
x = radius * np.cos(np.linspace(0, 2 * np.pi, 1000))
y = radius * np.sin(np.linspace(0, 2 * np.pi, 1000))
graph.plot(x, y, pen=pg.mkPen(width=6))
メモリを描画する
for second in range(60):
    # 5の倍数のメモリは少し長く太くしてそれっぽさを出す
    line_length = 0.1 if second % 5 == 0 else 0.05
    line_width = 4 if second % 5 == 0 else 2

    # メモリの始点と終点の座標を求める
    x1 = np.sin(np.radians(360 * (second / 60))) * radius
    x2 = np.sin(np.radians(360 * (second / 60))) * (radius - line_length)
    y1 = np.cos(np.radians(360 * (second / 60))) * radius
    y2 = np.cos(np.radians(360 * (second / 60))) * (radius - line_length)

    # 描画する
    pen = pg.mkPen(width=line_width)
    pen.setCapStyle(QtCore.Qt.RoundCap)  # この設定をすることで線の端が丸くなります
    graph.plot([x1, x2], [y1, y2], pen=pen)
時間を描画する
hour_textsというリストにTextItemを保持していますが、これは後にウインドウサイズに応じてフォントサイズを変更するためです。
font_size = 64

hour_texts = []

for hour in range(1, 13, 1):
    x = np.sin(np.radians(360 * (hour / 12))) * radius * 0.8
    y = np.cos(np.radians(360 * (hour / 12))) * radius * 0.8

    # anchorは位置の基準をテキストのどこにおくかを指定します
    # anchor=(0, 0)だとテキストの左上、anchor=(1, 1)だと右下が基準になります
    # ここではテキストの中心を基準にするためにanchor=(0.5, 0.5)とします
    hour_text = pg.TextItem(text=str(hour), anchor=(0.5, 0.5))
    # 位置を設定する
    hour_text.setPos(x, y)
    # フォントサイズを指定する
    font = QtGui.QFont()
    font.setPixelSize(font_size)
    hour_text.setFont(font)
    graph.addItem(hour_text)
    hour_texts.append(hour_text)
日付とデジタル時刻を描画する
# 日付と曜日
dt_now = datetime.datetime.now()
date_str = '{}/{}/{} {}'.format(dt_now.year, dt_now.month, dt_now.day, dt_now.strftime('%a'))
date_text = pg.TextItem(text=date_str, anchor=(0.5, 0.5))
date_text.setPos(0, -radius / 3.5)
font = QtGui.QFont()
font.setPixelSize(int(font_size / 2))
date_text.setFont(font)
graph.addItem(date_text)

# 時刻のデジタル表示
time_text = pg.TextItem(text='00:00:00', anchor=(0.5, 0.5))
time_text.setPos(0, -radius / 2.5)
time_text.setFont(font)
graph.addItem(time_text)
時計の針を定義する
時計の針は英語でhandらしいです。これを作ったときはじめて知りました。
# 短針
pen = pg.mkPen(width=12)
pen.setCapStyle(QtCore.Qt.RoundCap)
hour_hand_plot = graph.plot(pen=pen)

# 長針
pen = pg.mkPen(width=6)
pen.setCapStyle(QtCore.Qt.RoundCap)
minute_hand_plot = graph.plot(pen=pen)

# 秒針
pen = pg.mkPen(width=2)
pen.setCapStyle(QtCore.Qt.RoundCap)
second_hand_plot = graph.plot(pen=pen)
時計を指定時刻にセットする関数を定義する
def set_time(hour, minute, second):
    # 時計の針の角度(12時の方向が0度で右回りが正)
    deg_second = (second / 60) * 360
    deg_minute = (minute / 60) * 360 + (1 / 60) * 360 * (second / 60)
    deg_hour = (hour / 12) * 360 + (1 / 12) * 360 * (minute / 60)

    # 針の長さを適当に決める
    second_hand_length = 0.85
    minute_hand_length = 0.8
    hour_hand_length = 0.5

    # 針を描画する
    x_second = np.sin(np.radians(deg_second)) * radius * second_hand_length
    y_second = np.cos(np.radians(deg_second)) * radius * second_hand_length
    second_hand_plot.setData([0, x_second], [0, y_second])

    x_minute = np.sin(np.radians(deg_minute)) * radius * minute_hand_length
    y_minute = np.cos(np.radians(deg_minute)) * radius * minute_hand_length
    minute_hand_plot.setData([0, x_minute], [0, y_minute])

    x_hour = np.sin(np.radians(deg_hour)) * radius * hour_hand_length
    y_hour = np.cos(np.radians(deg_hour)) * radius * hour_hand_length
    hour_hand_plot.setData([0, x_hour], [0, y_hour])

    # デジタル表示を描画する
    time_str = '{:02d}:{:02d}:{:02d}'.format(hour, minute, second)
    time_text.setText(time_str)
ここで試しに10時10分35秒を表示してみます。
set_time(10, 10, 35)
ウインドウサイズが変わったときのフォントサイズを調整する
時計をリアルタイムに合わせて動かす前に、フォントサイズの自動調整を実装します。これまでのコードではウインドウサイズが変わってもフォントサイズは変わらないため、このようにウインドウサイズを小さくするともはや時間が読めません。

まずはウインドウサイズに応じてフォントサイズを調整する関数を定義します。
def resize_text():
    # ウインドウサイズの取得
    size = win.size()
    height = size.height()
    width = size.width()

    # 調整後のフォントサイズ
    new_font_size= font_size * (min(height, width) / init_window_size)

    # フォントサイズを適用する
    font = QtGui.QFont()
    font.setPixelSize(int(new_font_size/ 2))
    date_text.setFont(font)
    time_text.setFont(font)

    for hour_text in hour_texts:
        font = QtGui.QFont()
        font.setPixelSize(new_font_size)
        hour_text.setFont(font)
次にフォントサイズを調整する関数を一定時間おきに実行するタイマーを用意します。
resize_timer = QtCore.QTimer()
resize_timer.timeout.connect(resize_text)  # タイマーにフォントサイズを調整する関数をセットする
resize_timer.start(200)  # 200msおきに関数を実行する
これでウインドウサイズを小さくしてもそれに合わせてフォントサイズも小さくなります。
線の太さは変わりませんが、同じ方法で線の太さも調整することもできます(ここでは割愛)。

時計の時刻をリアルタイムに合わせてセットする
呼び出すと現在の時刻に設定してくれる関数を定義します。
def update_clock():
    dt_now = datetime.datetime.now()
    h = dt_now.hour
    m = dt_now.minute
    s = dt_now.second

    set_time(h, m, s)
フォントサイズのときと同じように一定時間おきに関数を実行します。
update_timer = QtCore.QTimer()
update_timer.timeout.connect(update_clock)
update_timer.start(50)  # 更新周期は50ms
完成
おわりに
pyqtgraphっていろいろ作れそうでおもしろいですね。


