はじめに
論文に掲載する図は大きさを著者が思った通りの大きさにしておいた方が組版の際にきれいに仕上がる可能性が高い。しかし、余白を削除すると、思った通りの大きさにならないことがあるので、そのことを分析し、解決策をメモします。
余白の削除
fig.savefigでbbox_inchesを使うと、描画ファイルの外側の余白をtrimmingできます。しかし、それをすると、図の大きさがplt.figureで指定したfigsizeの通りになりません。trimmingのあるなしを比較します。
import matplotlib.pyplot as plt
fig, ax = plt.subplots(figsize=(6,4))
fig.savefig("original.png")
figure_size_check("original.png")
fig.savefig("trimmed.png",bbox_inches="tight",pad_inches=0)
figure_size_check("trimmed.png")
figure_size_checkは出力された画像のサイズを計測するためのもの。気になる人は、画像サイズの計測へジャンプ。出力は下記の通り
[original.png]
(W: 100.000 dpi, H: 100.000 dpi)
(W: 6.000 in, H: 4.000 in )
(W: 600.000 px, H: 400.000 px )
[trimmed.png]
(W: 100.000 dpi, H: 100.000 dpi)
(W: 5.030 in, H: 3.340 in )
(W: 503.000 px, H: 334.000 px )
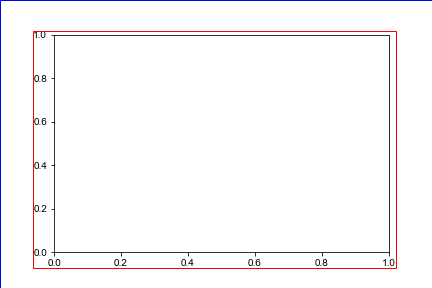
trimmed.pngは(6 in, 4 in)の幅ではなく、(5.030 in, 3.340 in)になってしまいました。下記の赤い部分だけがくりぬかれたことになります。
インチ(in)とポイント(pt)とセンチメートル(cm)
1 in = 72 pt
1 in = 2.54 cm
1 cm = 28.346 pt
1 pt = 0.3528 mm
です。pythonのデフォルト設定の図のサイズは6 in × 4 in (15.24 cm x 10.10 cm)です。
紙のサイズ
A4は横210 mm x 縦297 mm = 横8.27 in × 縦11.69 inなので、紙の余白を考えると、横幅6 inより大きな図は論文の図として適当ではありません。
リサイズする方法 (1)
fig.tight_layout(pad=0)を利用すると、問題を解決できます。ただし、この方法はplt.subplotsを利用している場合に限定されます。
import matplotlib.pyplot as plt
fig, ax = plt.subplots(figsize=(6,4),dpi=100)
fig.tight_layout(pad=0.0)
fig.savefig("tight_layout.png")
figure_size_check("tight_layout.png")
これにより(6in x 4in)の図に調整されます。
[tight_layout.png]
(W: 100.000 dpi, H: 100.000 dpi)
(W: 6.000 in, H: 4.000 in )
(W: 600.000 px, H: 400.000 px )
リサイズする方法 (2)
renderer = fig.canvas.get_renderer()及びfig.get_tightbox(renderer=render)によってtrimmingした際の図の寸法を測ることができます。この寸法が与えられた寸法に一致するように、ずれている倍率を徐々に乗じていきます。この反復によって、与えらえた寸法に一致させます。
def figure_adjustment(fig, pad_inches, eps=1e-15):
    import numpy as np

    print("Figure adjustment function")

    figX, figY = fig.get_size_inches()
    print("Given inches:", figX, figY)

    figX -= pad_inches * 2.0
    figY -= pad_inches * 2.0
    fx, fy = 1.0, 1.0
    nt = 0
    error = 1.0

    renderer = fig.canvas.get_renderer()

    while error > eps:
        tight_render = fig.get_tightbbox(renderer=renderer)
        width = tight_render.width
        height = tight_render.height
        fx *= figX / width
        fy *= figY / height
        fig.set_figwidth(figX * fx)
        fig.set_figheight(figY * fy)
        error = np.sqrt((figX-width)**2 + (figY-height)**2)
        print("iter={0:3d}: (W:{1:15.13f}in, H:{2:15.13f}in)".format(nt, width, height))
        nt += 1
        if nt > 50: break

    tight_render = fig.get_tightbbox(renderer=renderer)
    width = tight_render.width + 2.0 * pad_inches
    height = tight_render.height + 2.0 * pad_inches
    print("final figure size:(W:{0:6.3f}in, H:{1:6.3f}in)".format(width, height))
    print("final figure size:(W:{0:6.0f}px, H:{1:6.0f}px)".format(width * fig.dpi, height * fig.dpi))

    print(tight_render.width,tight_render.height)

    return
プログラムの使い方
import matplotlib.pyplot as plt
fig, ax = plt.subplots(figsize=(6,4),dpi=100)
figure_adjustment(fig, pad_inches=0)
fig.savefig("resized.png",bbox_inches="tight",pad_inches=0)
figure_size_check("resized.png")
出力結果は下記の通り。
Figure adjustment function
Given inches: 6.0 4.0
iter= 0: (W:5.0378472222222in, H:3.3422222222222in)
iter= 1: (W:5.9259270347524in, H:3.9483924349882in)
iter= 2: (W:5.9951519832012in, H:3.9965726176909in)
iter= 3: (W:5.9996863649405in, H:3.9997751233641in)
iter= 4: (W:5.9999797251924in, H:3.9999852572584in)
iter= 5: (W:5.9999986894076in, H:3.9999990335278in)
iter= 6: (W:5.9999999152817in, H:3.9999999366424in)
iter= 7: (W:5.9999999945237in, H:3.9999999958466in)
iter= 8: (W:5.9999999996460in, H:3.9999999997277in)
iter= 9: (W:5.9999999999771in, H:3.9999999999822in)
iter= 10: (W:5.9999999999985in, H:3.9999999999988in)
iter= 11: (W:5.9999999999999in, H:3.9999999999999in)
iter= 12: (W:6.0000000000000in, H:4.0000000000000in)
iter= 13: (W:6.0000000000000in, H:4.0000000000000in)
iter= 14: (W:6.0000000000000in, H:4.0000000000000in)
final figure size:(W: 6.000in, H: 4.000in)
final figure size:(W: 600px, H: 400px)
6.0 4.0
[resized.png]
(W: 100.000 dpi, H: 100.000 dpi)
(W: 6.000 in, H: 4.000 in )
(W: 600.000 px, H: 400.000 px )
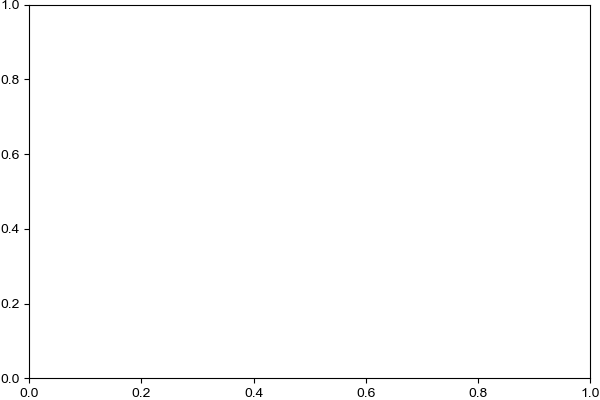
出力された画像ファイル
6 in×4 inの画像が完成しました。

画像サイズの計測
def figure_size_check(filepath):
    from PIL import Image
    with Image.open(filepath) as img:
        width, height = img.size
        dpi = img.info.get("dpi")

    print("\n[{:s}]".format(filepath))
    print("(W:{0:8.3f} dpi, H:{1:8.3f} dpi)".format(*dpi))
    print("(W:{0:8.3f} in,  H:{1:8.3f} in )".format(width / dpi[0], height / dpi[1]))
    print("(W:{0:8.3f} px,  H:{1:8.3f} px )".format(width, height))

    return