Matplotlib 可視化の練習として、
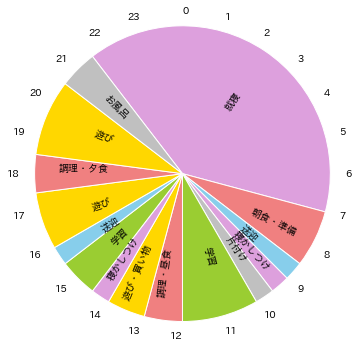
育休中のとある1日のタイムスケジュールを円グラフにしてみた。
※ 初心者すぎてコードが美しくないですがご了承ください。
※ 美しい書き方教えてください。
ざっくり手順
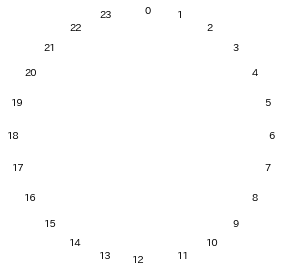
①外側グラフを24分割し、0~23のラベルを記載、グラフカラーを白にした。
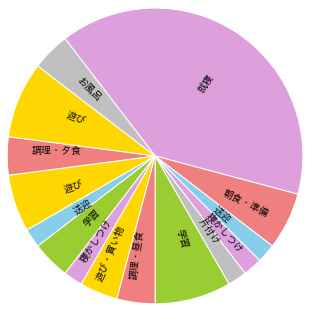
②内側グラフを時間分割し、ラベル、ラベル位置、グラフ角度、カラーを指定。
③上記の①②をがっちゃんこ。
実際のコード
まず外側グラフの内容を確認。
# 外側のドーナツ作成

time_label = ["0","1", "2", "3", "4", "5", "6", "7", "8", "9", "10",
        "11", "12", "13", "14", "15", "16", "17", "18", "19",
        "20", "21", "22", "23"]

x_time_label = np.array([1, 1, 1, 1, 1, 1, 1, 1, 1, 1,
        1, 1, 1, 1, 1, 1, 1, 1, 1, 1, 1, 1, 1, 1])

wedgeprops={"width":0, "edgecolor":'white'}

plt.pie(x_time_label , radius=1.3, labels=time_label,
    startangle=97.5, counterclock=False, colors=colors,
    wedgeprops= wedgeprops)
次に内側グラフの内容を確認。
# 内側のドーナツ作成

label = ["就寝", "朝食・準備", "送迎", "寝かしつけ", "片付け", "学習",
     "調理・昼食", "遊び・買い物", "寝かしつけ", "学習", "送迎",
     "遊び", "調理・夕食", "遊び", "お風呂"]

colors = ["plum","lightcoral", "skyblue", "plum", "silver",
          "yellowgreen", "lightcoral", "gold", "plum", "yellowgreen",
          "skyblue", "gold", "lightcoral", "gold", "silver" ]

plt.pie(x, labels=label, counterclock=False, startangle=127.5,

wedgeprops={'linewidth': 1, 'edgecolor':"white"},
        colors=colors, radius=1.7, labeldistance=0.5, rotatelabels=True)
最後に、上記コードを一緒に書いてグラフをがっちゃんこしてみます。
# 外側のドーナツ作成

time_label = ["0","1", "2", "3", "4", "5", "6", "7", "8", "9", "10",
        "11", "12", "13", "14", "15", "16", "17", "18", "19",
        "20", "21", "22", "23"]

x_time_label = np.array([1, 1, 1, 1, 1, 1, 1, 1, 1, 1,
        1, 1, 1, 1, 1, 1, 1, 1, 1, 1, 1, 1, 1, 1])

wedgeprops={"width":0, "edgecolor":'white'}

plt.pie(x_time_label , radius=1.3, labels=time_label,
    startangle=97.5, counterclock=False, colors=colors,
    wedgeprops= wedgeprops)


# 内側のドーナツ作成

label = ["就寝", "朝食・準備", "送迎", "寝かしつけ", "片付け", "学習",
     "調理・昼食", "遊び・買い物", "寝かしつけ", "学習", "送迎",
     "遊び", "調理・夕食", "遊び", "お風呂"]

colors = ["plum","lightcoral", "skyblue", "plum", "silver",
          "yellowgreen", "lightcoral", "gold", "plum", "yellowgreen",
          "skyblue", "gold", "lightcoral", "gold", "silver" ]

plt.pie(x, labels=label, counterclock=False, startangle=127.5,

wedgeprops={'linewidth': 1, 'edgecolor':"white"},
        colors=colors, radius=1.7, labeldistance=0.5, rotatelabels=True)


plt.show()
作ってみて気づいたこと
寝すぎやん!
(子供の寝かしつけで一緒にねてしまう...)
(夜泣きがあるから朝おきられない...)
夜泣きを無くすねんねトレーニングを始める決心ができました。
参考サイト
こちらを参考にしました。
https://www.yutaka-note.com/entry/matplotlib_pie#%E3%83%A9%E3%83%99%E3%83%AB%E3%81%AE%E4%BD%8D%E7%BD%AE


