Matplotlibを使って、よくバロメーターを表すのに使われる多角形のレーダーチャート(スパイダーチャート)を作ってみます。
ちょっと公式サンプルから見た目を変えたいだけなのにかなり難儀しました。
実装
rader_chart.py
# -*- coding: utf-8 -*-
import os
import numpy as np
import matplotlib
import matplotlib.pyplot as plt
from matplotlib.patches import Circle, RegularPolygon
from matplotlib.path import Path
from matplotlib.projections.polar import PolarAxes
from matplotlib.projections import register_projection
from matplotlib.spines import Spine
from matplotlib.transforms import Affine2D
from matplotlib.font_manager import FontProperties
def radar_factory(num_vars, frame='circle'):
"""Create a radar chart with `num_vars` axes.
This function creates a RadarAxes projection and registers it.
Parameters
----------
num_vars : int
Number of variables for radar chart.
frame : {'circle' | 'polygon'}
Shape of frame surrounding axes.
"""
# calculate evenly-spaced axis angles
theta = np.linspace(0, 2*np.pi, num_vars, endpoint=False)
class RadarAxes(PolarAxes):
name = 'radar'
def __init__(self, *args, **kwargs):
super().__init__(*args, **kwargs)
# rotate plot such that the first axis is at the top
self.set_theta_zero_location('N')
def fill(self, *args, closed=True, **kwargs):
"""Override fill so that line is closed by default"""
return super().fill(closed=closed, *args, **kwargs)
def plot(self, *args, **kwargs):
"""Override plot so that line is closed by default"""
lines = super().plot(*args, **kwargs)
for line in lines:
self._close_line(line)
def _close_line(self, line):
x, y = line.get_data()
# FIXME: markers at x[0], y[0] get doubled-up
if x[0] != x[-1]:
x = np.concatenate((x, [x[0]]))
y = np.concatenate((y, [y[0]]))
line.set_data(x, y)
def set_varlabels(self, labels, font):
self.set_thetagrids(np.degrees(theta), labels, fontproperties=font)
def _gen_axes_patch(self):
# The Axes patch must be centered at (0.5, 0.5) and of radius 0.5
# in axes coordinates.
if frame == 'circle':
return Circle((0.5, 0.5), 0.5)
elif frame == 'polygon':
return RegularPolygon((0.5, 0.5), num_vars,
radius=.5, edgecolor="k")
else:
raise ValueError("unknown value for 'frame': %s" % frame)
def draw(self, renderer):
""" Draw. If frame is polygon, make gridlines polygon-shaped """
if frame == 'polygon':
gridlines = self.yaxis.get_gridlines()
for gl in gridlines:
gl.get_path()._interpolation_steps = num_vars
super().draw(renderer)
def _gen_axes_spines(self):
if frame == 'circle':
return super()._gen_axes_spines()
elif frame == 'polygon':
# spine_type must be 'left'/'right'/'top'/'bottom'/'circle'.
spine = Spine(axes=self,
spine_type='circle',
path=Path.unit_regular_polygon(num_vars))
# unit_regular_polygon gives a polygon of radius 1 centered at
# (0, 0) but we want a polygon of radius 0.5 centered at (0.5,
# 0.5) in axes coordinates.
spine.set_transform(Affine2D().scale(.5).translate(.5, .5)
+ self.transAxes)
return {'polar': spine}
else:
raise ValueError("unknown value for 'frame': %s" % frame)
register_projection(RadarAxes)
return theta
if __name__ == '__main__':
# 日本語フォントの利用
if os.name == 'nt':
font_path = r'c:\Windows\Fonts\meiryo.ttc'
else:
font_path = './meiryo.ttf'
font = FontProperties(fname=font_path)
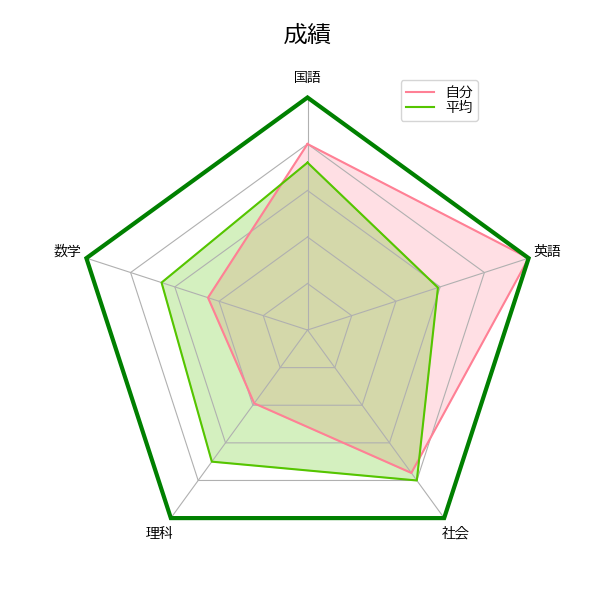
# ラベルとデータ
data = [
['国語', '数学', '理科', '社会', '英語'],
('成績', [
[80, 45, 39, 76, 100],
[72, 66, 70, 80, 59],
]),
]
# データの色
colors = ['#FF8095', '#55C500']
# 外枠の装飾
matplotlib.rc('axes',edgecolor='green', linewidth=3)
N = len(data[0])
theta = radar_factory(N, frame='polygon') # polygon:多角形、circle:円
spoke_labels = data.pop(0)
title, case_data = data[0]
fig, ax = plt.subplots(figsize=(6, 6), subplot_kw=dict(projection='radar'))
fig.subplots_adjust(top=0.85, bottom=0.05)
# メモリ線を引く
ax.set_rgrids([20, 40, 60, 80])
# 最大最小値の設定
ax.set_ylim([0, 100])
# タイトルのセット
ax.set_title(title, position=(0.5, 1.1), ha='center', fontproperties=font, fontsize='xx-large')
# レーダーチャートの色、透明度を設定
i = 0
for d in case_data:
line = ax.plot(theta, d, color=colors[i]) # 枠線の描画
ax.fill(theta, d, alpha=0.25, color=colors[i]) # 塗りつぶし
i = i + 1
# 角のラベルを設定
ax.set_varlabels(spoke_labels, font)
# ラベルの表示非表示
plt.tick_params(labelbottom=True, # 角ラベル表示
labelleft=False) # メモリラベル非表示
# 説明の描画
legend_info = ('自分', '平均')
plt.legend(legend_info, loc=(0.7, .95), labelspacing=0.1, fontsize='medium', prop=font)
# 図全体の背景透明度
fig.patch.set_alpha(0)
#plt.show() # ウィンドウで確認
fig.savefig('chart.png') #ファイルに保存
出力結果