はじめに
仕事でフローチャートのようなものを作る必要が生じた.
普段は英語版でいいのだが,今回は,英語版・日本語版双方を作る必要が生じたので,「matplotlibでフローチャートのようなものを描く」プログラムの見直しを行った.それほど頻繁に使うものでもないので,あとで使うときに,何をやっているか,すぐに思い出せるよう配慮した(つもり).
前の投稿はこれ.
Python, matplotlibでフローチャートのようなものを強引に描く
今回のプログラムの特徴は(といっても大したことはないが...)
- 基本はグラフ用紙の上にボックス・テキスト・矢印を,目で見て修正しながら仕上げる(前と同じ)
- 日本語も含め,フォントを選択できるようにした(変数:fp).
- 作図領域の横幅は固定であるが,縦は縦横比(変数:Raspect)で調整するようにした.
- チャート作成時は,グリッド・座標軸を表示し,完成したと思ったらグリッド・座標軸を消して画像をファイル出力する(前と同じ:変数:iflag).iflag==0 なら,plt.axis('off') で軸を非表示にして,グリッドも描かない.
作業環境は以下の通り.
- MacBook Pro (Retina, 13-inch, Mid 2014)
- macOS High Sierra
- Python 3.6.4
ここで紹介する事例は以下の3点である.
- グラフ用紙(チャートを書くためのグラフ用紙:内容は含まず)
- 日本語を用いた簡単なチャート
- 少し複雑な英語版チャート
グラフ用紙
このプログラムは,座標軸とグリッドを表示するだけであり,中身は含まれていない.
すなわち,座標軸とグリッド以外表示しない.
しかし,これをベースに中身を書き加えて行けるよう,フォント指定などの部分は含んでいる.
注意事項は以下の通り.
- フォント指定のため,from matplotlib.font_manager import FontProperties をインポートしておく.
- フォントはフルパスで指定する.フォントのフルパスは,ImageMagick がインストールされていれば convert -list font で確認するのが便利.
- 座標軸・グリッドを表示したければ,iflag=1,非表示にしたければ iflag=0 とする.
- 描画する座標の範囲は,xmin, xmax, ymin, ymax で指定する
- y軸は,ax1.set_ylim([ymax,ymin]) により,下方向に数値が増加するよう指定.
- 描画範囲の縦横比(アスペクトレシオ)は,Raspect で指定.ここでは Raspect=1 としている.
# Flowchart
from math import *                                   # 数学関数使用
import matplotlib.pyplot as plt                      # 基本 pyplot
from matplotlib.patches import Polygon,Rectangle     # Polygon, Rectangle使用
from matplotlib.ticker import *                      # MultipleLocator使用
from matplotlib.font_manager import FontProperties   # フォント指定のため

# フォントをフルパスで指定
# fon='/Library/Fonts/Arial.ttf'
# fon='/System/Library/Fonts/Helvetica.ttc'
# fon='/Library/Fonts/Tahoma.ttf'
fon='/Library/Fonts/Times New Roman.ttf'
# fon='/Users/kk/Library/Fonts/ipaexg.ttf'
fp=FontProperties(fname=fon) # 使用フォント指定


# iflag=0: without axis and grid, iflag=1: with axis and grid
iflag=1 # グリッド・座標軸表示有無の指定

# definition if the range of axis
xmin=-8
xmax=8
ymin=0
ymax=5
Raspect=1 # 縦横比指定
iw=abs(xmax-xmin)/2
ih=abs(ymin-ymax)/abs(xmax-xmin)*iw*Raspect

fig = plt.figure(figsize=(iw,ih),facecolor='w')
ax1 = fig.add_subplot(1,1,1, adjustable='box', aspect=Raspect)
ax1.set_xlim([xmin,xmax])
ax1.set_ylim([ymax,ymin])
if iflag==0: # グリッド・座標軸非表示
    plt.axis('off')
else:
    ax1.tick_params(labelsize=10)
    ax1.xaxis.set_major_locator(MultipleLocator(1))
    ax1.yaxis.set_major_locator(MultipleLocator(1))
    plt.grid(which='major',lw=0.3, color='#777777',linestyle='-')

fsz=20 # font size
plt.rcParams["font.size"] = fsz
plt.rcParams['font.family'] ='sans-serif'
#################################################
#     (something to draw)                       #
#################################################

# ================================================
if iflag==0:
    fnameF='fig_gra1.png'
    plt.savefig(fnameF, dpi=200, bbox_inches="tight", pad_inches=0.1)
plt.show()
作例

日本語を用いた簡単なチャート
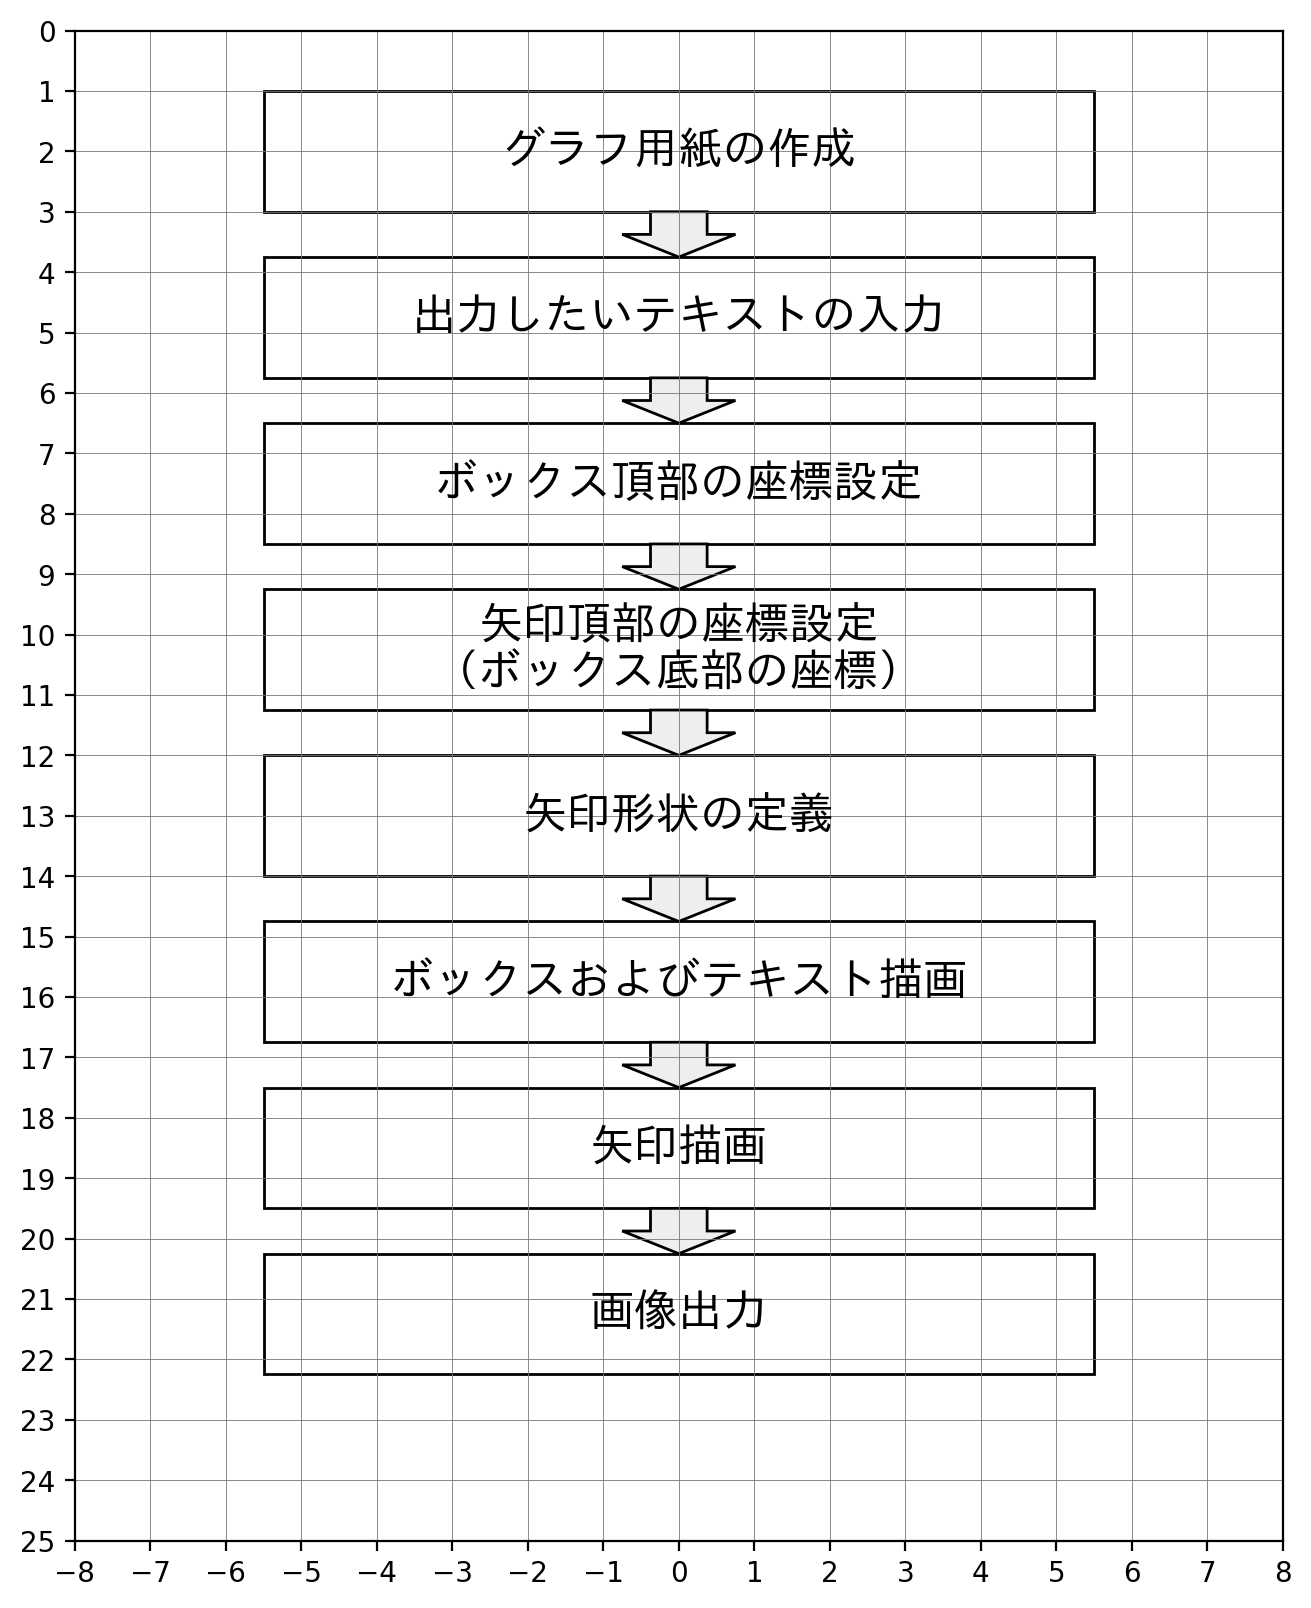
日本語を用いた簡単なチャートの事例を示す.
やっていることは以下の通り.
- フォントは ipaexg.ttf (fon='/Users/kk/Library/Fonts/ipaexg.ttf')
- グリッド・座標軸を表示(iflag=1)
- 描画範囲は,x 方向は -8〜+8,y 方向は 0〜25 まで.
- 縦横比は Raspect=0.8 に指定.
- フォントサイズは fsz=16 に指定.
- リスト ss[] に描画したい文字列を格納
- Rectangle で描画したボックスの中に文字列を描画していく.
- 矢印は,少しカッコつけて自前で Polygon で定義
# Flowchart
from math import *
import matplotlib.pyplot as plt
from matplotlib.patches import Polygon,Rectangle
from matplotlib.ticker import *
from matplotlib.font_manager import FontProperties

# fon='/Library/Fonts/Arial.ttf'
# fon='/System/Library/Fonts/Helvetica.ttc'
# fon='/Library/Fonts/Tahoma.ttf'
# fon='/Library/Fonts/Times New Roman.ttf'
fon='/Users/kk/Library/Fonts/ipaexg.ttf'
fp=FontProperties(fname=fon)

# iflag=0: without axis and grid, iflag=1: with axis and grid
iflag=1

# definition if the range of axis
xmin=-8
xmax=8
ymin=0
ymax=25
Raspect=0.8
iw=abs(xmax-xmin)/2
ih=abs(ymin-ymax)/abs(xmax-xmin)*iw*Raspect

fig = plt.figure(figsize=(iw,ih),facecolor='w')
ax1 = fig.add_subplot(1,1,1, adjustable='box', aspect=Raspect)
ax1.set_xlim([xmin,xmax])
ax1.set_ylim([ymax,ymin])
if iflag==0:
    plt.axis('off')
else:
    ax1.tick_params(labelsize=10)
    ax1.xaxis.set_major_locator(MultipleLocator(1))
    ax1.yaxis.set_major_locator(MultipleLocator(1))
    plt.grid(which='major',lw=0.3, color='#777777',linestyle='-')

fsz=16 # font size
plt.rcParams["font.size"] = fsz
plt.rcParams['font.family'] ='sans-serif'
#################################################
#     (something to draw)                       #
#################################################
# store texts drawn
ss=[]
ss=ss+[u'グラフ用紙の作成']
ss=ss+[u'出力したいテキストの入力']
ss=ss+[u'ボックス頂部の座標設定']
ss=ss+[u'矢印頂部の座標設定\n(ボックス底部の座標)']
ss=ss+[u'矢印形状の定義']
ss=ss+[u'ボックスおよびテキスト描画']
ss=ss+[u'矢印描画']
ss=ss+[u'画像出力']

# define top of box
dyt=2 # height of text box
dya=0.75 # height of allow
yt=[]
for i in range(0,len(ss)):
    if i==0:
        _y=1
    else:
        _y=_y+dyt+dya
    yt=yt+[float(_y)]

# define top of allow
ya=[]
for i in range(0,len(ss)-1):
    if i==0:
        _y= 1+dyt
    else:
        _y=_y+dya+dyt
    ya=ya+[float(_y)]
# define arrow shape
# total length of arrow: dya
dxa=dya*2 # totalwidth of arrow
x1=dxa/4; y1=0      #       7 + 1
x2=x1   ; y2=dya/2  #       +   +
x3=dxa/2; y3=y2     #       +   +
x4=0    ; y4=dya    #   5 + 6    2 + 3
x5=-x3  ; y5=y3     #     +       +
x6=-x2  ; y6=y2     #       +   +
x7=-x1  ; y7=y1     #         4

# draw text and box
xi=-5.5 # left edge of box
dx=11   # width of box
xx=0    # center of text
for i in range(0,len(ss)):
    yi=yt[i]
    ax1.add_patch(Rectangle((xi,yi),dx,dyt,fc='#ffffff',ec='#000000'))
    yy=yi+dyt/2
    ax1.text(xx,yy,ss[i],fontsize=fsz,ha='center',va='center',fontproperties=fp)

# draw arrows
for i in range(0,len(ya)):
    yi=ya[i]
    yi1=y1+yi
    yi2=y2+yi
    yi3=y3+yi
    yi4=y4+yi
    yi5=y5+yi
    yi6=y6+yi
    yi7=y7+yi
    xy=([x1,yi1],[x1,yi1],[x2,yi2],[x3,yi3],[x4,yi4],[x5,yi5],[x6,yi6],[x7,yi7])
    ax1.add_patch(Polygon(xy,closed=True,fc='#eeeeee',ec='#000000'))


# ================================================
if iflag==0:
    fnameF='fig_gra2.png'
    plt.savefig(fnameF, dpi=200, bbox_inches="tight", pad_inches=0.1)
plt.show()
作例
少し複雑な英語版チャート
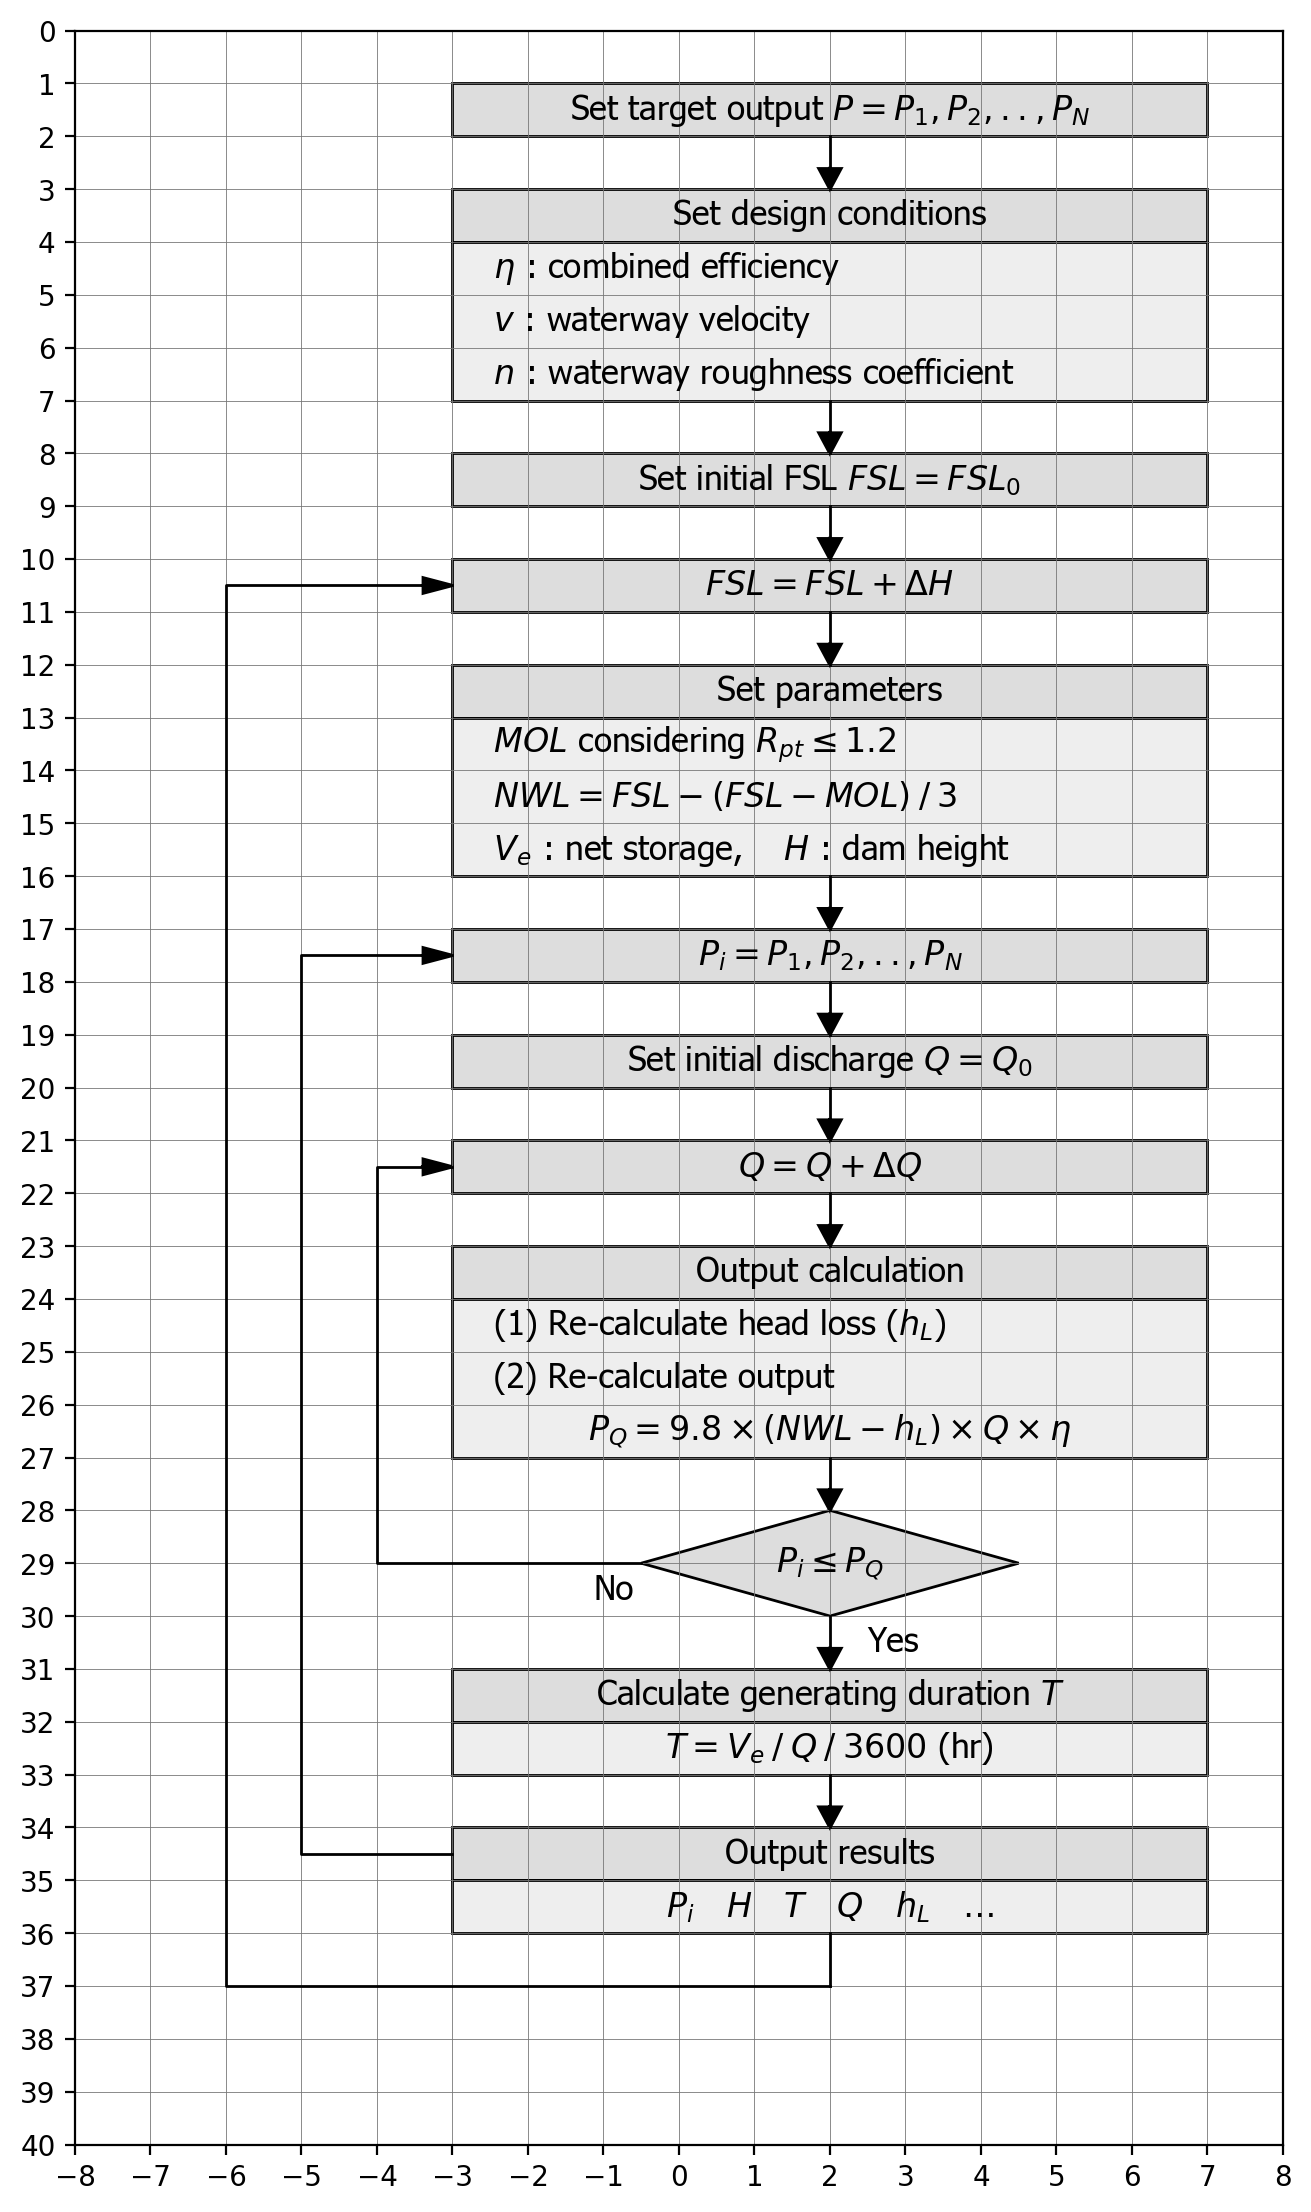
少し複雑な英語版チャートの事例を示す.
やっていることは以下の通り.
- フォントは tahoma.ttf (fon='/Library/Fonts/Tahoma.ttf')
- グリッド・座標軸を表示(iflag=1)
- 描画範囲は,x 方向は -8〜+8,y 方向は 0〜40 まで.
- 縦横比は Raspect=0.7 に指定.
- フォントサイズは fsz=12 に指定.
- リスト a[] に描画したい文字列を格納
- リスト nln=[] は1アイテム(1つのかたまり)の中の行数を格納する
- リスト nsp=[] は1アイテムを示すボックスの形を格納する.0 はボックス(長方形),1 はひし形.
- Polygon でボックスおよび判断を示すひし形を描画し,その中に文字列を描画していく.
- 濃い灰色のボックスにはメインアイテムの文字列を,薄い灰色のボックスにはサブアイテムの文字列を描画している.
- ボックスとボックスを結ぶ線は plot で先に描画してしまう.
- 矢印は,頭の部分だけ arrow によりあとから描画する.
# Flowchart
from math import *
import matplotlib.pyplot as plt
from matplotlib.patches import Polygon,Rectangle
from matplotlib.ticker import *
from matplotlib.font_manager import FontProperties

# fon='/Library/Fonts/Arial.ttf'
# fon='/System/Library/Fonts/Helvetica.ttc'
fon='/Library/Fonts/Tahoma.ttf'
# fon='/Library/Fonts/Times New Roman.ttf'
fp=FontProperties(fname=fon)

# iflag=0: without axis and grid, iflag=1: with axis and grid
iflag=1

# definition if the range of axis
xmin=-8
xmax=8
ymin=0
ymax=40
Raspect=0.7
iw=abs(xmax-xmin)/2
ih=abs(ymin-ymax)/abs(xmax-xmin)*iw*Raspect

fig = plt.figure(figsize=(iw,ih),facecolor='w')
ax1 = fig.add_subplot(1,1,1, adjustable='box', aspect=Raspect)
ax1.set_xlim([xmin,xmax])
ax1.set_ylim([ymax,ymin])
if iflag==0:
    plt.axis('off')
else:
    ax1.tick_params(labelsize=10)
    ax1.xaxis.set_major_locator(MultipleLocator(1))
    ax1.yaxis.set_major_locator(MultipleLocator(1))
    plt.grid(which='major',lw=0.3, color='#777777',linestyle='-')

fsz=12 # font size
plt.rcParams["font.size"] = fsz
plt.rcParams['font.family'] ='sans-serif'
#################################################
#     (something to draw)                       #
#################################################
# Store texts drawn
a=[] # text
nln=[] # number of lines in 1 item
nsp=[] # shape (0: rectangle, 1: diamond)
nln=nln+[int(1)]
nsp=nsp+[int(0)]
a=a+['Set target output $P=P_1,P_2,..,P_N$']
nln=nln+[int(4)]
nsp=nsp+[int(0)]
a=a+['Set design conditions']
a=a+['    $\eta$ : combined efficiency']
a=a+['    $v$ : waterway velocity']
a=a+['    $n$ : waterway roughness coefficient']
nln=nln+[int(1)]
nsp=nsp+[int(0)]
a=a+['Set initial FSL $FSL=FSL_0$']
nln=nln+[int(1)]
nsp=nsp+[int(0)]
a=a+['$FSL=FSL+\Delta H$']
nln=nln+[int(4)]
nsp=nsp+[int(0)]
a=a+['Set parameters']
a=a+['    $MOL$ considering $R_{pt}\leq 1.2$']
a=a+['    $NWL=FSL-(FSL-MOL)\:/\:3$']
a=a+['    $V_e$ : net storage,    $H$ : dam height']
nln=nln+[int(1)]
nsp=nsp+[int(0)]
a=a+['$P_i=P_1,P_2,..,P_N$']
nln=nln+[int(1)]
nsp=nsp+[int(0)]
a=a+['Set initial discharge $Q=Q_0$']
nln=nln+[int(1)]
nsp=nsp+[int(0)]
a=a+['$Q=Q+\Delta Q$']
nln=nln+[int(4)]
nsp=nsp+[int(0)]
a=a+['Output calculation']
a=a+['    (1) Re-calculate head loss ($h_L$)']
a=a+['    (2) Re-calculate output']
a=a+['$P_Q=9.8 \\times (NWL-h_L) \\times Q \\times \eta$']
nln=nln+[int(1)]
nsp=nsp+[int(1)]
a=a+['$P_i \leq P_Q$']
nln=nln+[int(2)]
nsp=nsp+[int(0)]
a=a+['Calculate generating duration $T$']
a=a+['$T=V_e \:/\: Q \:/\: 3600$ (hr)']
nln=nln+[int(2)]
nsp=nsp+[int(0)]
a=a+['Output results']
a=a+['$P_i \quad H \quad T \quad Q \quad h_L \quad \dots$'];

dh=1       # height of 1 line
dx=10      # width of box
x0=2       # location of center
xs=x0-dx/2 # starting coordinate of x of box
xe=x0+dx/2 # ending coordinate of x of box
i=-1       # initialization of line counter

# Draw text and box
for nl, ns in zip(nln,nsp):
    if ns==0: # rectangle
        # main item
        if i==-1: ye=0
        ys=ye+dh; ye=ys+dh
        xy=([xs,ys],[xe,ys],[xe,ye],[xs,ye])
        poly = Polygon(xy, facecolor='#dddddd', edgecolor='#000000',lw=1)
        ax1.add_patch(poly)
        i=i+1; ax1.text(x0,ys+dh*1/2,a[i],fontsize=fsz,ha='center',va='center',fontproperties=fp)
        if 2<=nl: # sub-items
            ys=ye; ye=ys+(nl-1)*dh
            xy=[(xs,ys),(xe,ys),(xe,ye),(xs,ye)]
            poly = Polygon(xy, facecolor='#eeeeee', edgecolor='#000000',lw=1)
            ax1.add_patch(poly)
            for j in range(0,nl-1):
                i=i+1
                if a[i][0]=='$':
                    ax1.text(x0,ys+dh*(2*j+1)/2,a[i],fontsize=fsz,ha='center',va='center',fontproperties=fp)
                else:
                    ax1.text(xs,ys+dh*(2*j+1)/2,a[i],fontsize=fsz,ha='left',va='center',fontproperties=fp)
    if ns==1: # diamond (main item)
        ys=ye+dh; ye=ys+2*dh
        xy=([x0,ys],[x0+dx/4,0.5*(ys+ye)],[x0,ye],[x0-dx/4,0.5*(ys+ye)])
        poly = Polygon(xy, facecolor='#dddddd', edgecolor='#000000',lw=1)
        ax1.add_patch(poly)
        i=i+1; ax1.text(x0,0.5*(ys+ye),a[i],fontsize=fsz,ha='center',va='center',fontproperties=fp)

# draw lines on center line
eln=[3,8,10,12,17,19,21,23,28,31,34,37] # y-coordinate of line end
for el in eln:
    ax1.plot([x0,x0],[el-dh, el],color='#000000',lw=1)
# draw arrows on center line
hw=0.3; hl=0.4
for el in eln[0:len(eln)-1]:
    ax1.arrow(x0, el-hl,0, 0.01,fc='#000000',ec='#000000',head_width=hw,head_length=hl)

# draw lines
x1=x0-dx/4  ; y1=29
x2=x0-dx/2-1; y2=29
x3=x0-dx/2-1; y3=21.5
x4=x0-dx/2  ; y4=21.5
ax1.plot([x1,x2,x3,x4],[y1,y2,y3,y4],color='#000000',lw=1)
x1=x0-dx/2  ; y1=34.5
x2=x0-dx/2-2; y2=34.5
x3=x0-dx/2-2; y3=17.5
x4=x0-dx/2  ; y4=17.5
ax1.plot([x1,x2,x3,x4],[y1,y2,y3,y4],color='#000000',lw=1)
x1=x0       ; y1=37
x2=x0-dx/2-3; y2=37
x3=x0-dx/2-3; y3=10.5
x4=x0-dx/2  ; y4=10.5
ax1.plot([x1,x2,x3,x4],[y1,y2,y3,y4],color='#000000',lw=1)
# draw arrows
hw=0.3; hl=0.4
ax1.arrow(x0-dx/2-hl,21.5,0.01,0,fc='#000000',ec='#000000',head_width=hw,head_length=hl)
ax1.arrow(x0-dx/2-hl,17.5,0.01,0,fc='#000000',ec='#000000',head_width=hw,head_length=hl)
ax1.arrow(x0-dx/2-hl,10.5,0.01,0,fc='#000000',ec='#000000',head_width=hw,head_length=hl)
# draw text
ax1.text(x0-dx/4-0.1,29.5,'No',fontsize=fsz,ha='right',va='center',fontproperties=fp)
ax1.text(x0+0.5,30.5,'Yes',fontsize=fsz,ha='left',va='center',fontproperties=fp)


# ================================================
if iflag==0:
    fnameF='fig_gra3.png'
    plt.savefig(fnameF, dpi=200, bbox_inches="tight", pad_inches=0.1)
plt.show()
作例
追記:日本語を用いた簡単なチャート(annotateで矢印)
- 矢印をannotateで書いてみました.
- ax1.xxx は使わず,全て plt.xxx で書いてみました.
# Flowchart
from math import *
import matplotlib.pyplot as plt
from matplotlib.patches import Polygon,Rectangle
from matplotlib.ticker import *
from matplotlib.font_manager import FontProperties

# fon='/Library/Fonts/Arial.ttf'
# fon='/System/Library/Fonts/Helvetica.ttc'
# fon='/Library/Fonts/Tahoma.ttf'
# fon='/Library/Fonts/Times New Roman.ttf'
fon='/Users/kk/Library/Fonts/ipaexg.ttf'
fp=FontProperties(fname=fon)

# iflag=0: without axis and grid, iflag=1: with axis and grid
iflag=1

# definition if the range of axis
xmin=-8
xmax=8
ymin=0
ymax=25
Raspect=0.8
iw=abs(xmax-xmin)/2
ih=abs(ymin-ymax)/abs(xmax-xmin)*iw*Raspect

fig = plt.figure(figsize=(iw,ih),facecolor='w')
plt.gca().set_aspect(Raspect,adjustable='box')
plt.xlim([xmin,xmax])
plt.ylim([ymax,ymin])
if iflag==0:
    plt.axis('off')
else:
    plt.gca().tick_params(labelsize=10)
    plt.gca().xaxis.set_major_locator(MultipleLocator(1))
    plt.gca().yaxis.set_major_locator(MultipleLocator(1))
    plt.grid(which='major',lw=0.3, color='#777777',linestyle='-')

fsz=16 # font size
plt.rcParams["font.size"] = fsz
plt.rcParams['font.family'] ='sans-serif'
#################################################
#     (something to draw)                       #
#################################################
# store texts drawn
ss=[]
ss=ss+[u'グラフ用紙の作成']
ss=ss+[u'出力したいテキストの入力']
ss=ss+[u'ボックス頂部の座標設定']
ss=ss+[u'矢印頂部の座標設定\n(ボックス底部の座標)']
ss=ss+[u'矢印形状の定義']
ss=ss+[u'ボックスおよびテキスト描画']
ss=ss+[u'矢印描画']
ss=ss+[u'画像出力']

# define top of box
dyt=2 # height of text box
dya=0.75 # height of allow
yt=[]
for i in range(0,len(ss)):
    if i==0:
        _y=1
    else:
        _y=_y+dyt+dya
    yt=yt+[float(_y)]

# define top of allow
ya=[]
for i in range(0,len(ss)-1):
    if i==0:
        _y= 1+dyt
    else:
        _y=_y+dya+dyt
    ya=ya+[float(_y)]

# draw text and box
xi=-5.5 # left edge of box
dx=11   # width of box
xx=0    # center of text
for i in range(0,len(ss)):
    yi=yt[i]
    plt.fill([xi,xi,xi+dx,xi+dx],[yi,yi+dyt,yi+dyt,yi],fc='#ffffff',ec='#000000')
    yy=yi+dyt/2
    plt.text(xx,yy,ss[i],fontsize=fsz,ha='center',va='center',fontproperties=fp)

# draw arrow
sv=0
for y2 in ya:
    y1=y2+dya
    x1=0; x2=x1
    plt.annotate('',
        xy=(x1,y1), xycoords='data',
        xytext=(x2,y2), textcoords='data', fontsize=0,
        arrowprops=dict(shrink=sv,width=20,headwidth=40,headlength=10,
                        connectionstyle='arc3',facecolor='#eeeeee',edgecolor='#000000'))

# ================================================
if iflag==0:
    fnameF='fig_gra2.png'
    plt.savefig(fnameF, dpi=200, bbox_inches="tight", pad_inches=0.1)
plt.show()
以 上