2018.08.28:破壊基準説明図の作成プログラムはこちら(Python matplotlib 説明図を書いてみる(改訂版))のほうが出来がいいと思いますので,参照いただければと思います.
はじめに
このような図を作りました.

通常この手の説明図は,矢印の扱いの便利さからGMT(Generic Mapping Tools)を使って描くのですが,matplotlib は,TeX 表記の数式を受け入れてくれるのが便利なので matplotlib での作成に挑戦してみました.私にとって,matplotlib での説明図作成における課題は,矢印の扱いです.水平・鉛直のみでアスペクト比が equal の場合なら,arrow を使うなどの手段もありますが,任意の角度の矢印を引く方法を模索した結果,annotate を使うことにしました.この投稿では,matplotlib の annotate で矢印を描く場合の,いくつかの試行結果と,上述説明図のプログラミングについて紹介します.
なお,annotate とは本来「注釈をつける」という意味なので,これを座標軸の描画に使ったり,寸法線として用いるのはどうかと思う方もいると思いますが,プログラミングを本職としない人間にとっては,一発必中でかっこいい図が作れればそれでいいので,「使えるものは使っておく」という発想でやっておりますので,ご容赦願います.
参考サイト
- matplotlib.pyplot.annotate: https://matplotlib.org/api/_as_gen/matplotlib.pyplot.annotate.html
- matplotlib Annotation: https://matplotlib.org/users/annotations.html
- matplotlibのannotateのhead_widthを設定すると、エラーが返ってくる: http://naga-tsuzuki.sblo.jp/archives/20170717-1.html
試行における課題
matplotlib.pyplot.annotate: https://matplotlib.org/api/_as_gen/matplotlib.pyplot.annotate.html によれば,arrowprops で arrowstyle を指定した場合,width,headwidth,headlength,shrink が使えないと記載されています.arrowstyle を指定しなくても,片矢印なら問題ないのですが,両矢印を使いたい場合,arrowstyle の指定が必要となります.
よって試行の課題として,arrowstyle を指定した場合の,矢印の書式をいかに記載するか?を設定しました.
試行1(arrowpropsでarrowstyleを指定しない)
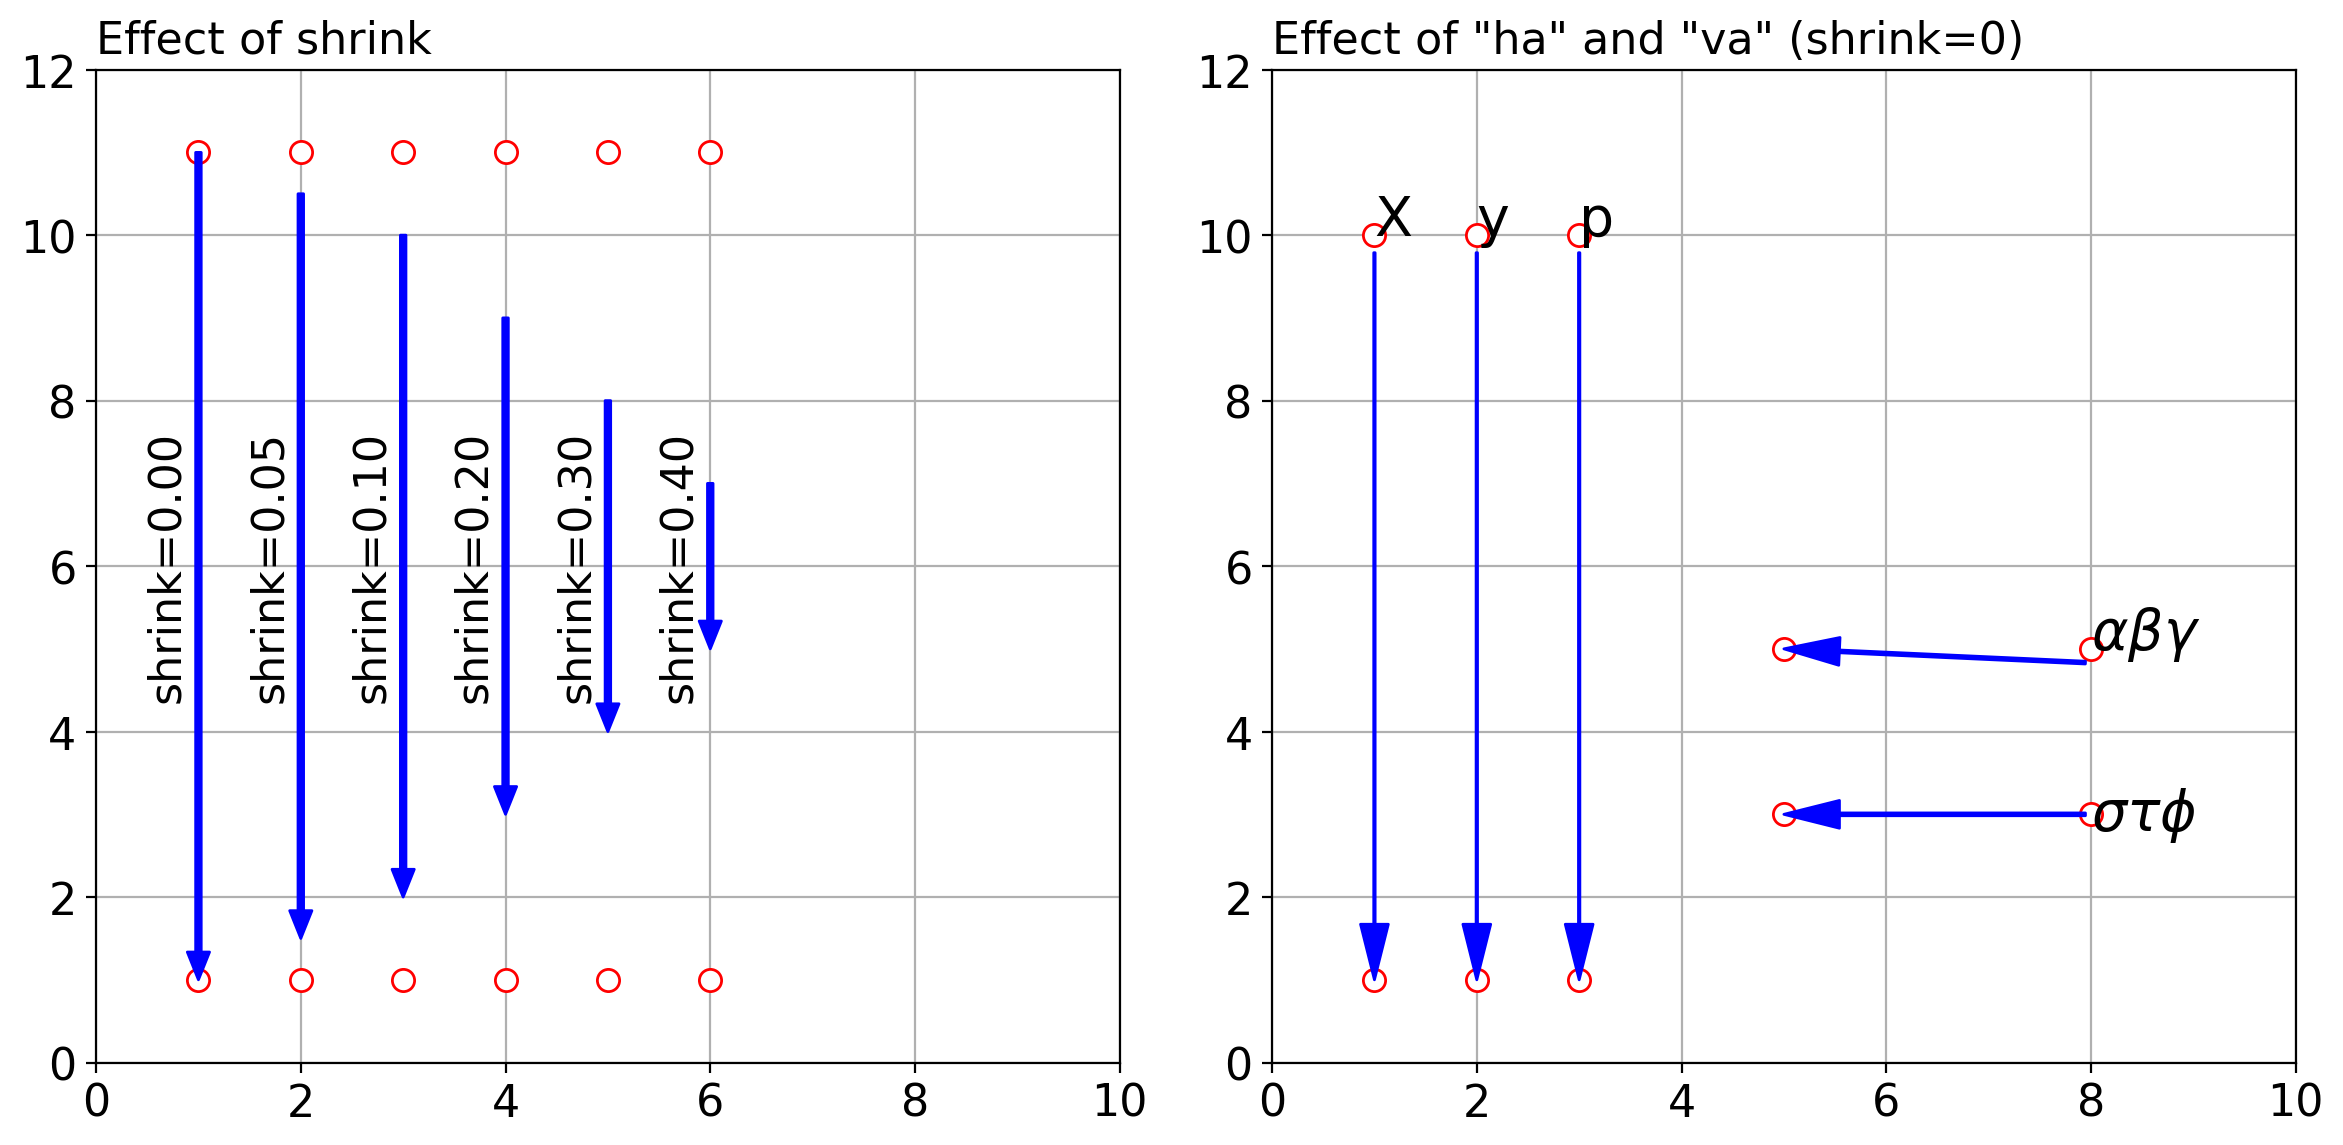
テキストなし状態における shirink の効果とテキストを配置した場合の事例について試行してみました.作例は以下の通り.左側図(subplot(121))が shrink の効果,右側図(subplot(122))がテキストを配置した場合の事例です.
上図中白抜き赤丸は,annotate の xy と xytext で指定した座標を示すます.annotate では,矢印は,xytext で指定した座標から xy で指定した座標に向かって描画されます.
subplot(121)
shirink=0 では,矢印は,指定点(テキスト側)から指定点(データ側)までの長さで描画されます.shirink がゼロ以外ですと,両側から指定した比率で矢印の長さが削らる,すなわ矢印の長さが縮みます(shrinkします).たとえば shrink=0.4 を指定すると,両側から 40% ずつ削られるので,座標での指定長さ 10 に対し,両側から 4 づつ削られるので,真ん中に長さ 2 の矢印が描画されることになります.この事例からわかるように,有効な shrink の値は 0.5 未満です.0.5 以上を指定しても矢印は描かれますが,意図しないものになります.
subplot(122)
shrink=0 として annotate にテキストを加えたものです.テキスト側の線の長さが若干削られているようです.ここで,テキスト $X$,$y$,$p$ および $\alpha\beta\gamma$ を伴った annotate には va(verticalalignment)と ha(horizontalalignment)を指定していません.図からわかるように,鉛直線は指定した座標間の中にありますが,水平矢印は,$\alpha\beta\gamma$ の場合のように,テキストを指定すると水平でなくなります.この場合,va(verticalalignment)と ha(horizontalalignment)を明確に指定することにより,$\sigma\tau\phi$ のように意図した矢印が引けるようになります.
プログラム
import numpy as np
import matplotlib.pyplot as plt

fig=plt.figure(figsize=(12,6),facecolor='w')
xmin=0; xmax=10
ymin=0; ymax=12
fsz=16

plt.subplot(121)
plt.rcParams['font.family'] = 'sans-serif'
plt.rcParams["font.size"] = fsz
plt.xlim([xmin,xmax])
plt.ylim([ymin,ymax])
plt.grid()
asv=np.array([0, 0.05,0.1,0.2,0.3,0.4])
for i,sv in enumerate(asv):
    x1=float(i+1); y1=1
    x2=float(i+1); y2=11
    plt.annotate('',
        xy=(x1,y1), xycoords='data',
        xytext=(x2,y2), textcoords='data', fontsize=0,
        arrowprops=dict(shrink=sv,width=2,headwidth=8,headlength=10,
                        connectionstyle='arc3',facecolor='#0000ff',edgecolor='#0000ff'))
    plt.plot([x1],[y1],'o',ms=8,color='#ff0000',markerfacecolor='#ffffff',label='90 nos Tens-rebar',lw=1.5)
    plt.plot([x2],[y2],'o',ms=8,color='#ff0000',markerfacecolor='#ffffff',label='90 nos Tens-rebar',lw=1.5)
    plt.text(x1-0.1,0.5*(y1+y2),'shrink={0:4.2f}'.format(sv),va='center',ha='right',fontsize=fsz,rotation=90)
plt.title('Effect of shrink',loc='left',fontsize=fsz)

plt.subplot(122)
plt.rcParams['font.family'] = 'sans-serif'
plt.rcParams["font.size"] = fsz
plt.xlim([xmin,xmax])
plt.ylim([ymin,ymax])
plt.grid()
ass=['X','y','p']
for i,ss in enumerate(ass):
    sv=0
    x1=float(i+1); y1=1
    x2=float(i+1); y2=10
    plt.annotate(ss,
        xy=(x1,y1), xycoords='data',
        xytext=(x2,y2), textcoords='data', fontsize=20,
        arrowprops=dict(shrink=sv,width=0.5,headwidth=10,headlength=20,
                        connectionstyle='arc3',facecolor='#0000ff',edgecolor='#0000ff'))
    plt.plot([x1],[y1],'o',ms=8,color='#ff0000',markerfacecolor='#ffffff',label='90 nos Tens-rebar',lw=1.5)
    plt.plot([x2],[y2],'o',ms=8,color='#ff0000',markerfacecolor='#ffffff',label='90 nos Tens-rebar',lw=1.5)

ss=r'$\alpha\beta\gamma$'
sv=0; x1=5; x2=8; y1=5; y2=5
plt.annotate(ss,
    xy=(x1,y1), xycoords='data',
    xytext=(x2,y2), textcoords='data', fontsize=20,
    arrowprops=dict(shrink=sv,width=1,headwidth=10,headlength=20,
                    connectionstyle='arc3',facecolor='#0000ff',edgecolor='#0000ff'))
plt.plot([x1],[y1],'o',ms=8,color='#ff0000',markerfacecolor='#ffffff',label='90 nos Tens-rebar',lw=1.5)
plt.plot([x2],[y2],'o',ms=8,color='#ff0000',markerfacecolor='#ffffff',label='90 nos Tens-rebar',lw=1.5)

ss=r'$\sigma\tau\phi$'
sv=0; x1=5; x2=8; y1=3; y2=3
plt.annotate(ss,
    xy=(x1,y1), xycoords='data',
    xytext=(x2,y2), textcoords='data', fontsize=20,
    ha='left', va='center',
    arrowprops=dict(shrink=sv,width=1,headwidth=10,headlength=20,
                    connectionstyle='arc3',facecolor='#0000ff',edgecolor='#0000ff'))
plt.plot([x1],[y1],'o',ms=8,color='#ff0000',markerfacecolor='#ffffff',label='90 nos Tens-rebar',lw=1.5)
plt.plot([x2],[y2],'o',ms=8,color='#ff0000',markerfacecolor='#ffffff',label='90 nos Tens-rebar',lw=1.5)
plt.title('Effect of "ha" and "va" (shrink=0)',loc='left',fontsize=fsz)


plt.tight_layout()
fnameF='fig_annote1.png'
plt.savefig(fnameF, dpi=200, bbox_inches="tight", pad_inches=0.1)
plt.show()
試行2(arrowpropsでarrowstyleを指定した場合)
arrowprops で arrowstyle を指定した場合,矢印の詳細をどのように設定するかを調べて試してみました.arrowprops で arrowstyle を指定した場合,headwidth,headlength については,以下に記載がありました.
- matplotlibのannotateのhead_widthを設定すると、エラーが返ってくる: http://naga-tsuzuki.sblo.jp/archives/20170717-1.html
shrink については,以下に shrinkA,shrinkB というパラメータがあったのでこれを試してみました.
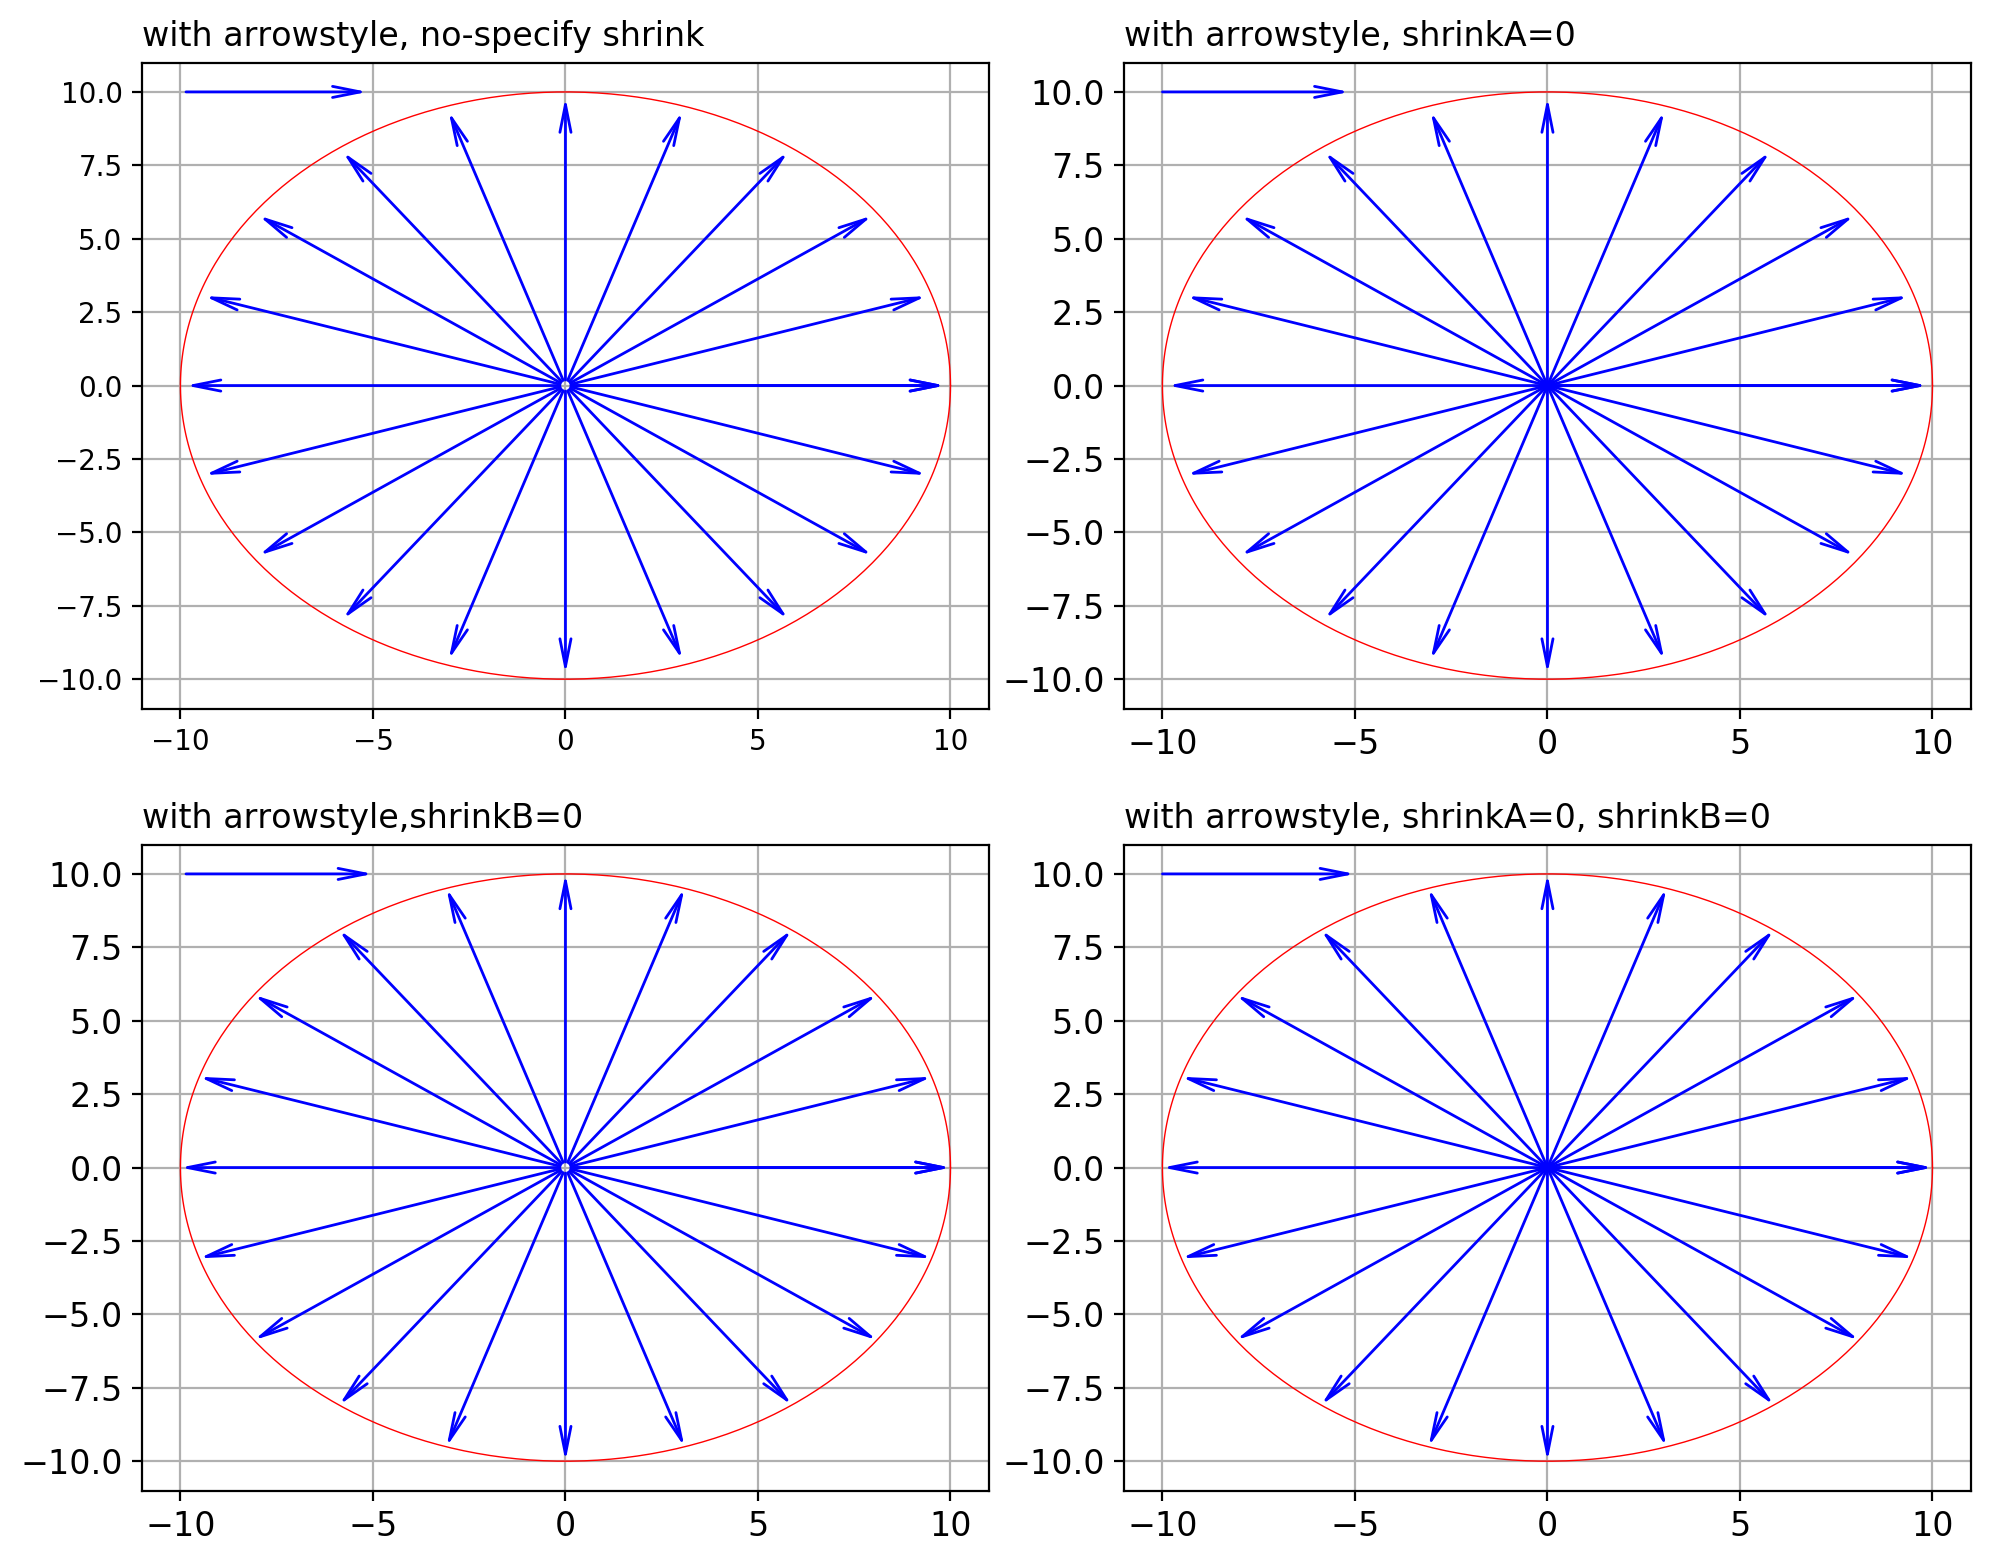
作例はこちら.半径 5 の円が赤線で描画されていますが,円の中心がテキスト側,円弧上の点がデータ側となります.
- shrink に関し何も指定しないと,テキスト側・データ側とも少し矢印の縮みが見られます.
- shrinkA=0 とするとテキスト側(円中心)の縮みがなくなります
- shrinkB=0 とするとデータ側(円弧上)の縮みがなくなります
- shrinkA=0,shrinkB=0 とすれば,テキスト側・データ側双方の縮みがなくなります.
プログラム
import numpy as np
import matplotlib.pyplot as plt

# test data
# circle
rr=10
theta=np.linspace(0,2*np.pi,360,endpoint=True)
x=rr*np.cos(theta)
y=rr*np.sin(theta)

# end points of arrows on a circle
phi=np.linspace(0,2*np.pi,21)
xx=rr*np.cos(phi)
yy=rr*np.sin(phi)

# for base shape of arrow
xb1=-5; yb1=10
xb2=-10; yb2=10

fig=plt.figure(figsize=(10,8),facecolor='w')
colc='#ff0000'
col='#0000ff'
fsz=12

plt.subplot(221)
plt.rcParams['font.family'] = 'sans-serif'
plt.rcParams["font.size"] = fsz
plt.plot(x,y,'-',color=colc,lw=0.5)
arst='->,head_width=2,head_length=10'
x2=0
y2=0
for x1,y1 in zip(xx,yy):
    plt.annotate('',
        xy=(x1,y1), xycoords='data',
        xytext=(x2,y2), textcoords='data', fontsize=0,
        arrowprops=dict(arrowstyle=arst,connectionstyle='arc3',facecolor=col,edgecolor=col))
plt.annotate('',
    xy=(xb1,yb1), xycoords='data',
    xytext=(xb2,yb2), textcoords='data', fontsize=0,
    arrowprops=dict(arrowstyle=arst,connectionstyle='arc3',facecolor=col,edgecolor=col))
plt.grid()
plt.title('with arrowstyle, no-specify shrink',loc='left',fontsize=fsz)

plt.subplot(222)
plt.rcParams['font.family'] = 'sans-serif'
plt.rcParams["font.size"] = fsz
plt.plot(x,y,'-',color=colc,lw=0.5)
arst='->,head_width=2,head_length=10'
x2=0
y2=0
for x1,y1 in zip(xx,yy):
    plt.annotate('',
        xy=(x1,y1), xycoords='data',
        xytext=(x2,y2), textcoords='data', fontsize=0,
        arrowprops=dict(arrowstyle=arst,connectionstyle='arc3',facecolor=col,edgecolor=col,shrinkA=0))
plt.annotate('',
    xy=(xb1,yb1), xycoords='data',
    xytext=(xb2,yb2), textcoords='data', fontsize=0,
    arrowprops=dict(arrowstyle=arst,connectionstyle='arc3',facecolor=col,edgecolor=col,shrinkA=0))
plt.grid()
plt.title('with arrowstyle, shrinkA=0',loc='left',fontsize=fsz)

plt.subplot(223)
plt.rcParams['font.family'] = 'sans-serif'
plt.rcParams["font.size"] = fsz
plt.plot(x,y,'-',color=colc,lw=0.5)
arst='->,head_width=2,head_length=10'
x2=0
y2=0
for x1,y1 in zip(xx,yy):
    plt.annotate('',
        xy=(x1,y1), xycoords='data',
        xytext=(x2,y2), textcoords='data', fontsize=0,
        arrowprops=dict(arrowstyle=arst,connectionstyle='arc3',facecolor=col,edgecolor=col,shrinkB=0))
plt.annotate('',
    xy=(xb1,yb1), xycoords='data',
    xytext=(xb2,yb2), textcoords='data', fontsize=0,
    arrowprops=dict(arrowstyle=arst,connectionstyle='arc3',facecolor=col,edgecolor=col,shrinkB=0))
plt.grid()
plt.title('with arrowstyle,shrinkB=0 ',loc='left',fontsize=fsz)

plt.subplot(224)
plt.rcParams['font.family'] = 'sans-serif'
plt.rcParams["font.size"] = fsz
plt.plot(x,y,'-',color=colc,lw=0.5)
arst='->,head_width=2,head_length=10'
x2=0
y2=0
for x1,y1 in zip(xx,yy):
    plt.annotate('',
        xy=(x1,y1), xycoords='data',
        xytext=(x2,y2), textcoords='data', fontsize=0,
        arrowprops=dict(arrowstyle=arst,connectionstyle='arc3',facecolor=col,edgecolor=col,shrinkA=0,shrinkB=0))
plt.annotate('',
    xy=(xb1,yb1), xycoords='data',
    xytext=(xb2,yb2), textcoords='data', fontsize=0,
    arrowprops=dict(arrowstyle=arst,connectionstyle='arc3',facecolor=col,edgecolor=col,shrinkA=0,shrinkB=0))
plt.grid()
plt.title('with arrowstyle, shrinkA=0, shrinkB=0',loc='left',fontsize=fsz)

plt.tight_layout()
fnameF='fig_annote2.png'
plt.savefig(fnameF, dpi=200, bbox_inches="tight", pad_inches=0.1)
plt.show()
直応力ーせん断応力平面模式図作成
これまでの知見を踏まえ,冒頭で紹介した直応力ーせん断応力平面模式図作成プログラムをやっていること毎に分割して示します.
モジュール読み込み
import numpy as np
import matplotlib.pyplot as plt
関数
両矢印およびテキスト表示箇所指定
ごたつく箇所なので,関数としてメインルーチンから分離.それぞれ以下の意味をもたせています.
| x1, y1 | plt.annotateにおけるデータ側座標 |
| x2, y2 | plt.annotateにおけるテキスト側座標 |
| xs, ys | plt.textにおけるテキスト描画座標 |
| ss | plt.textにおける描画テキスト(文字列) |
| rt | plt.textにおけるrotation(文字列の回転角度) |
両矢印とそれを説明するテキストはペアで処理しているので,def DRAWINFO により関連情報をリストに格納します.
def atext1(xa,ya,xc,yc,rr,sig1,sigt,phi,ds,cs,sn):
    x1=xa
    y1=ya
    x2=xc
    y2=yc
    xs=0.5*(xa+xc)-0.3*ds*cs
    ys=0.5*(ya+yc)+0.3*ds*sn
    ss=r'$D_1$'
    rt=90-phi
    return x1,y1,x2,y2,xs,ys,ss,rt

def atext2(xa,ya,xc,yc,rr,sig1,sigt,phi,ds,cs,sn):
    x1=xa+rr*sn+0.2*ds*cs
    y1=   rr*cs-0.2*ds*sn
    x2=xc+0.2*ds*cs
    y2=yc-0.2*ds*sn
    xs=0.5*(x1+x2)+0.3*ds*cs
    ys=0.5*(y1+y2)-0.3*ds*sn
    ss=r'$d_1$'
    rt=90-phi
    return x1,y1,x2,y2,xs,ys,ss,rt

def atext3(xa,ya,xc,yc,rr,sig1,sigt,phi,ds,cs,sn):
    x1=xa
    y1=-1.0
    x2=sigt
    y2=y1
    xs=(xa+sigt)/2
    ys=y1-0.3*ds
    ss=r'$D_2$'
    rt=0
    return x1,y1,x2,y2,xs,ys,ss,rt

def atext4(xa,ya,xc,yc,rr,sig1,sigt,phi,ds,cs,sn):
    x1=sig1
    y1=-0.3
    x2=sigt
    y2=y1
    xs=0.5*(sig1+sigt)
    ys=y1-0.3*ds
    ss=r'$d_2$'
    rt=0
    return x1,y1,x2,y2,xs,ys,ss,rt

def atext5(xa,ya,xc,yc,rr,sig1,sigt,phi,ds,cs,sn):
    x1=xa
    y1=ya
    x2=xa-rr*cs
    y2=ya+rr*sn
    xs=0.5*(x1+x2)+0.4*ds*sn
    ys=0.5*(y1+y2)+0.4*ds*cs
    ss=r'$\frac{\sigma_1-\sigma_2}{2}$'
    rt=-phi
    return x1,y1,x2,y2,xs,ys,ss,rt

def DRAWINFO(xa,ya,xc,yc,rr,sig1,sigt,phi,ds,cs,sn):
    _x1=[]; _y1=[]
    _x2=[]; _y2=[]
    _xs=[]; _ys=[]
    _ss=[]; _rt=[]

    x1,y1,x2,y2,xs,ys,ss,rt=atext1(xa,ya,xc,yc,rr,sig1,sigt,phi,ds,cs,sn)
    _x1=_x1+[x1]; _x2=_x2+[x2]; _y1=_y1+[y1]; _y2=_y2+[y2]; _xs=_xs+[xs]; _ys=_ys+[ys]; _ss=_ss+[ss]; _rt=_rt+[rt]

    x1,y1,x2,y2,xs,ys,ss,rt=atext2(xa,ya,xc,yc,rr,sig1,sigt,phi,ds,cs,sn)
    _x1=_x1+[x1]; _x2=_x2+[x2]; _y1=_y1+[y1]; _y2=_y2+[y2]; _xs=_xs+[xs]; _ys=_ys+[ys]; _ss=_ss+[ss]; _rt=_rt+[rt]

    x1,y1,x2,y2,xs,ys,ss,rt=atext3(xa,ya,xc,yc,rr,sig1,sigt,phi,ds,cs,sn)
    _x1=_x1+[x1]; _x2=_x2+[x2]; _y1=_y1+[y1]; _y2=_y2+[y2]; _xs=_xs+[xs]; _ys=_ys+[ys]; _ss=_ss+[ss]; _rt=_rt+[rt]

    x1,y1,x2,y2,xs,ys,ss,rt=atext4(xa,ya,xc,yc,rr,sig1,sigt,phi,ds,cs,sn)
    _x1=_x1+[x1]; _x2=_x2+[x2]; _y1=_y1+[y1]; _y2=_y2+[y2]; _xs=_xs+[xs]; _ys=_ys+[ys]; _ss=_ss+[ss]; _rt=_rt+[rt]

    x1,y1,x2,y2,xs,ys,ss,rt=atext5(xa,ya,xc,yc,rr,sig1,sigt,phi,ds,cs,sn)
    _x1=_x1+[x1]; _x2=_x2+[x2]; _y1=_y1+[y1]; _y2=_y2+[y2]; _xs=_xs+[xs]; _ys=_ys+[ys]; _ss=_ss+[ss]; _rt=_rt+[rt]

    return _x1, _y1, _x2, _y2, _xs, _ys, _ss, _rt
メインルーチン
作図用パラメータとグラフ全体像の定義
作図用パラメータとグラフ全体像を定義します.軸は自分で挿入するので,plt.axis('off') です.アスペクト比は equal です.
# Main routine
c=3; phi=30; sigt=2; sig1=-1; sig2=-7

xmin=-8; xmax=4
ymin=-2; ymax=7

ds=1
fsz=20
fig = plt.figure(figsize=(10,10),facecolor='w')
plt.rcParams['font.family'] = 'sans-serif'
plt.rcParams["font.size"] = fsz
plt.xlim([xmin,xmax])
plt.ylim([ymin,ymax])
plt.axis('off')
plt.gca().set_aspect('equal',adjustable='box')
座標軸描画
annotate により座標軸を描画します.
- ここでは,テキスト付き annotate とします.
- annotate におけるデータ側座標を左側に,テキスト側座標を右側に持ってきます.
- 矢印の形状(arrowstyle)は,矢の幅(head_width)・長さ(head_length)と合わせて変数 arst に格納します.
- 矢印は片矢印とし,テキスト側に矢を持ってきたいので,arrowstyle は <|-
としていることに注意.なぜなら,矢印 -|> はテキスト側からデータ側への矢印を示すからです. - ここでは,軸の長さは見てくれ問題なければいいので,shrink にはこだわらず指定しません.
- しかし,horizontalalignment と verticalalignment は指定しないと矢印が意図通りに設置されませんので,忘れずに指定します.
# coordinate
arst='<|-,head_width=0.3,head_length=0.5'
plt.annotate(r'$\sigma$',
    xy=(xmin,0), xycoords='data',
    xytext=(xmax-1,0), textcoords='data', fontsize=20,
    ha='left',va='center',
    arrowprops=dict(arrowstyle=arst,connectionstyle='arc3',facecolor='#000000',edgecolor='#000000'))
plt.annotate(r'$\tau$',
    xy=(0,0), xycoords='data',
    xytext=(0,ymax-1), textcoords='data', fontsize=20,
    ha='center',va='bottom',
    arrowprops=dict(arrowstyle=arst,connectionstyle='arc3',facecolor='#000000',edgecolor='#000000'))
破壊基準線とモール円描画
# failure criterion
x1=0.5*(sig1+sig2)-1
y1=c-np.tan(np.radians(phi))*x1
x2=sigt
y2=c-np.tan(np.radians(phi))*x2
plt.plot([x1,x2,x2],[y1,y2,0],'-',color='#0000ff',lw=2)
# Mohr circle
theta=np.linspace(0,np.pi,180,endpoint=True)
x=0.5*(sig1-sig2)*np.cos(theta)+0.5*(sig1+sig2)
y=0.5*(sig1-sig2)*np.sin(theta)
plt.plot(x,y,'-',color='#0000ff',lw=2)
作図用パラメータ計算
# Description
D1=(c-0.5*(sig1+sig2)*np.tan(np.radians(phi)))*np.cos(np.radians(phi))
cs=np.cos(np.radians(phi))
sn=np.sin(np.radians(phi))
rr=0.5*(sig1-sig2)

xa=0.5*(sig1+sig2)
ya=0
xc=xa+D1*sn
yc=D1*cs
矢印およびテキスト表示箇所情報の格納
関数を呼んで作図用情報をメインルーチンに取り込みます.
# drawing information
_x1, _y1, _x2, _y2, _xs, _ys, _ss, _rt=DRAWINFO(xa,ya,xc,yc,rr,sig1,sigt,phi,ds,cs,sn)
矢印とテキストの描画
annotate により両矢印を描画します.
- 矢印を説明するテキストは矢印の中央部に表示したいので別途 plt.text で描画します.
- 矢印の形状(arrowstyle)は,矢の幅(head_width)・長さ(head_length)と合わせて変数 arst に格納します.
- annotate のフォントサイズはテキストを伴わないので fontsize=0 とします.
- ここでは指定点から指定点までしっかり矢印を描画したいので,shrinkA=0 と shrinkB=0 を指定します.
# arrow and text
col='#333333'
arst='<->,head_width=3,head_length=10'
for i in range(0,len(_x1)):
    x1=_x1[i]; y1=_y1[i]
    x2=_x2[i]; y2=_y2[i]
    xs=_xs[i]; ys=_ys[i]
    ss=_ss[i]; rt=_rt[i]
    plt.annotate('',
        xy=(x1,y1), xycoords='data',
        xytext=(x2,y2), textcoords='data', fontsize=0,
        arrowprops=dict(arrowstyle=arst,connectionstyle='arc3',facecolor=col,edgecolor=col,shrinkA=0,shrinkB=0))
    plt.text(xs,ys,ss,ha='center',va='center',rotation=rt)
関連情報描画
以降は,普通に黒丸をプロットし,その近傍に説明用テキストを描画しています.
# points and text
plt.plot([sig2,0.5*(sig1+sig2),sig1,sigt,0,xc],[0,0,0,0,c,yc],'o',markersize=6,color='#000000')
plt.text(sigt+0.05*ds,0.05*ds,r'$\sigma_t$',va='bottom',ha='left')
plt.text(sig1+0.05*ds,0.05*ds,r'$\sigma_1$',va='bottom',ha='left')
plt.text(sig2-0.05*ds,0.05*ds,r'$\sigma_2$',va='bottom',ha='right')
plt.text(0+0.05*ds,c,r'$c$',va='bottom',ha='left')
plt.text(0.5*(sig1+sig2),-0.1*ds,r'$\frac{\sigma_1+\sigma_2}{2}$',va='top',ha='center')
plt.text(xa,c-xa*np.tan(np.radians(phi))-0.3*ds,"Mohr-Coulomb's\nFailure Criterion",va='center',ha='left',rotation=-phi,fontsize=fsz-2)
x1=sigt
y1=c-np.tan(np.radians(phi))*x1
plt.plot([1,x1],[y1,y1],'-',lw=0.8,color=col)
xs=0.8
ys=y1+0.3
plt.text(xs,ys,r'$\phi$',ha='center',va='center')
画像の保存と表示
fnameF='fig_mohr.png'
plt.savefig(fnameF, dpi=200, bbox_inches="tight", pad_inches=0.1)
plt.show()
以 上

