はじめに
SoftEther VPNはOSSのVPNソフトウェアです。これをPrometheusで監視するためのプラグインsoftether_exporterをRustで実装しました。(商用ライセンスのPacketiX VPNでも使用可能です)
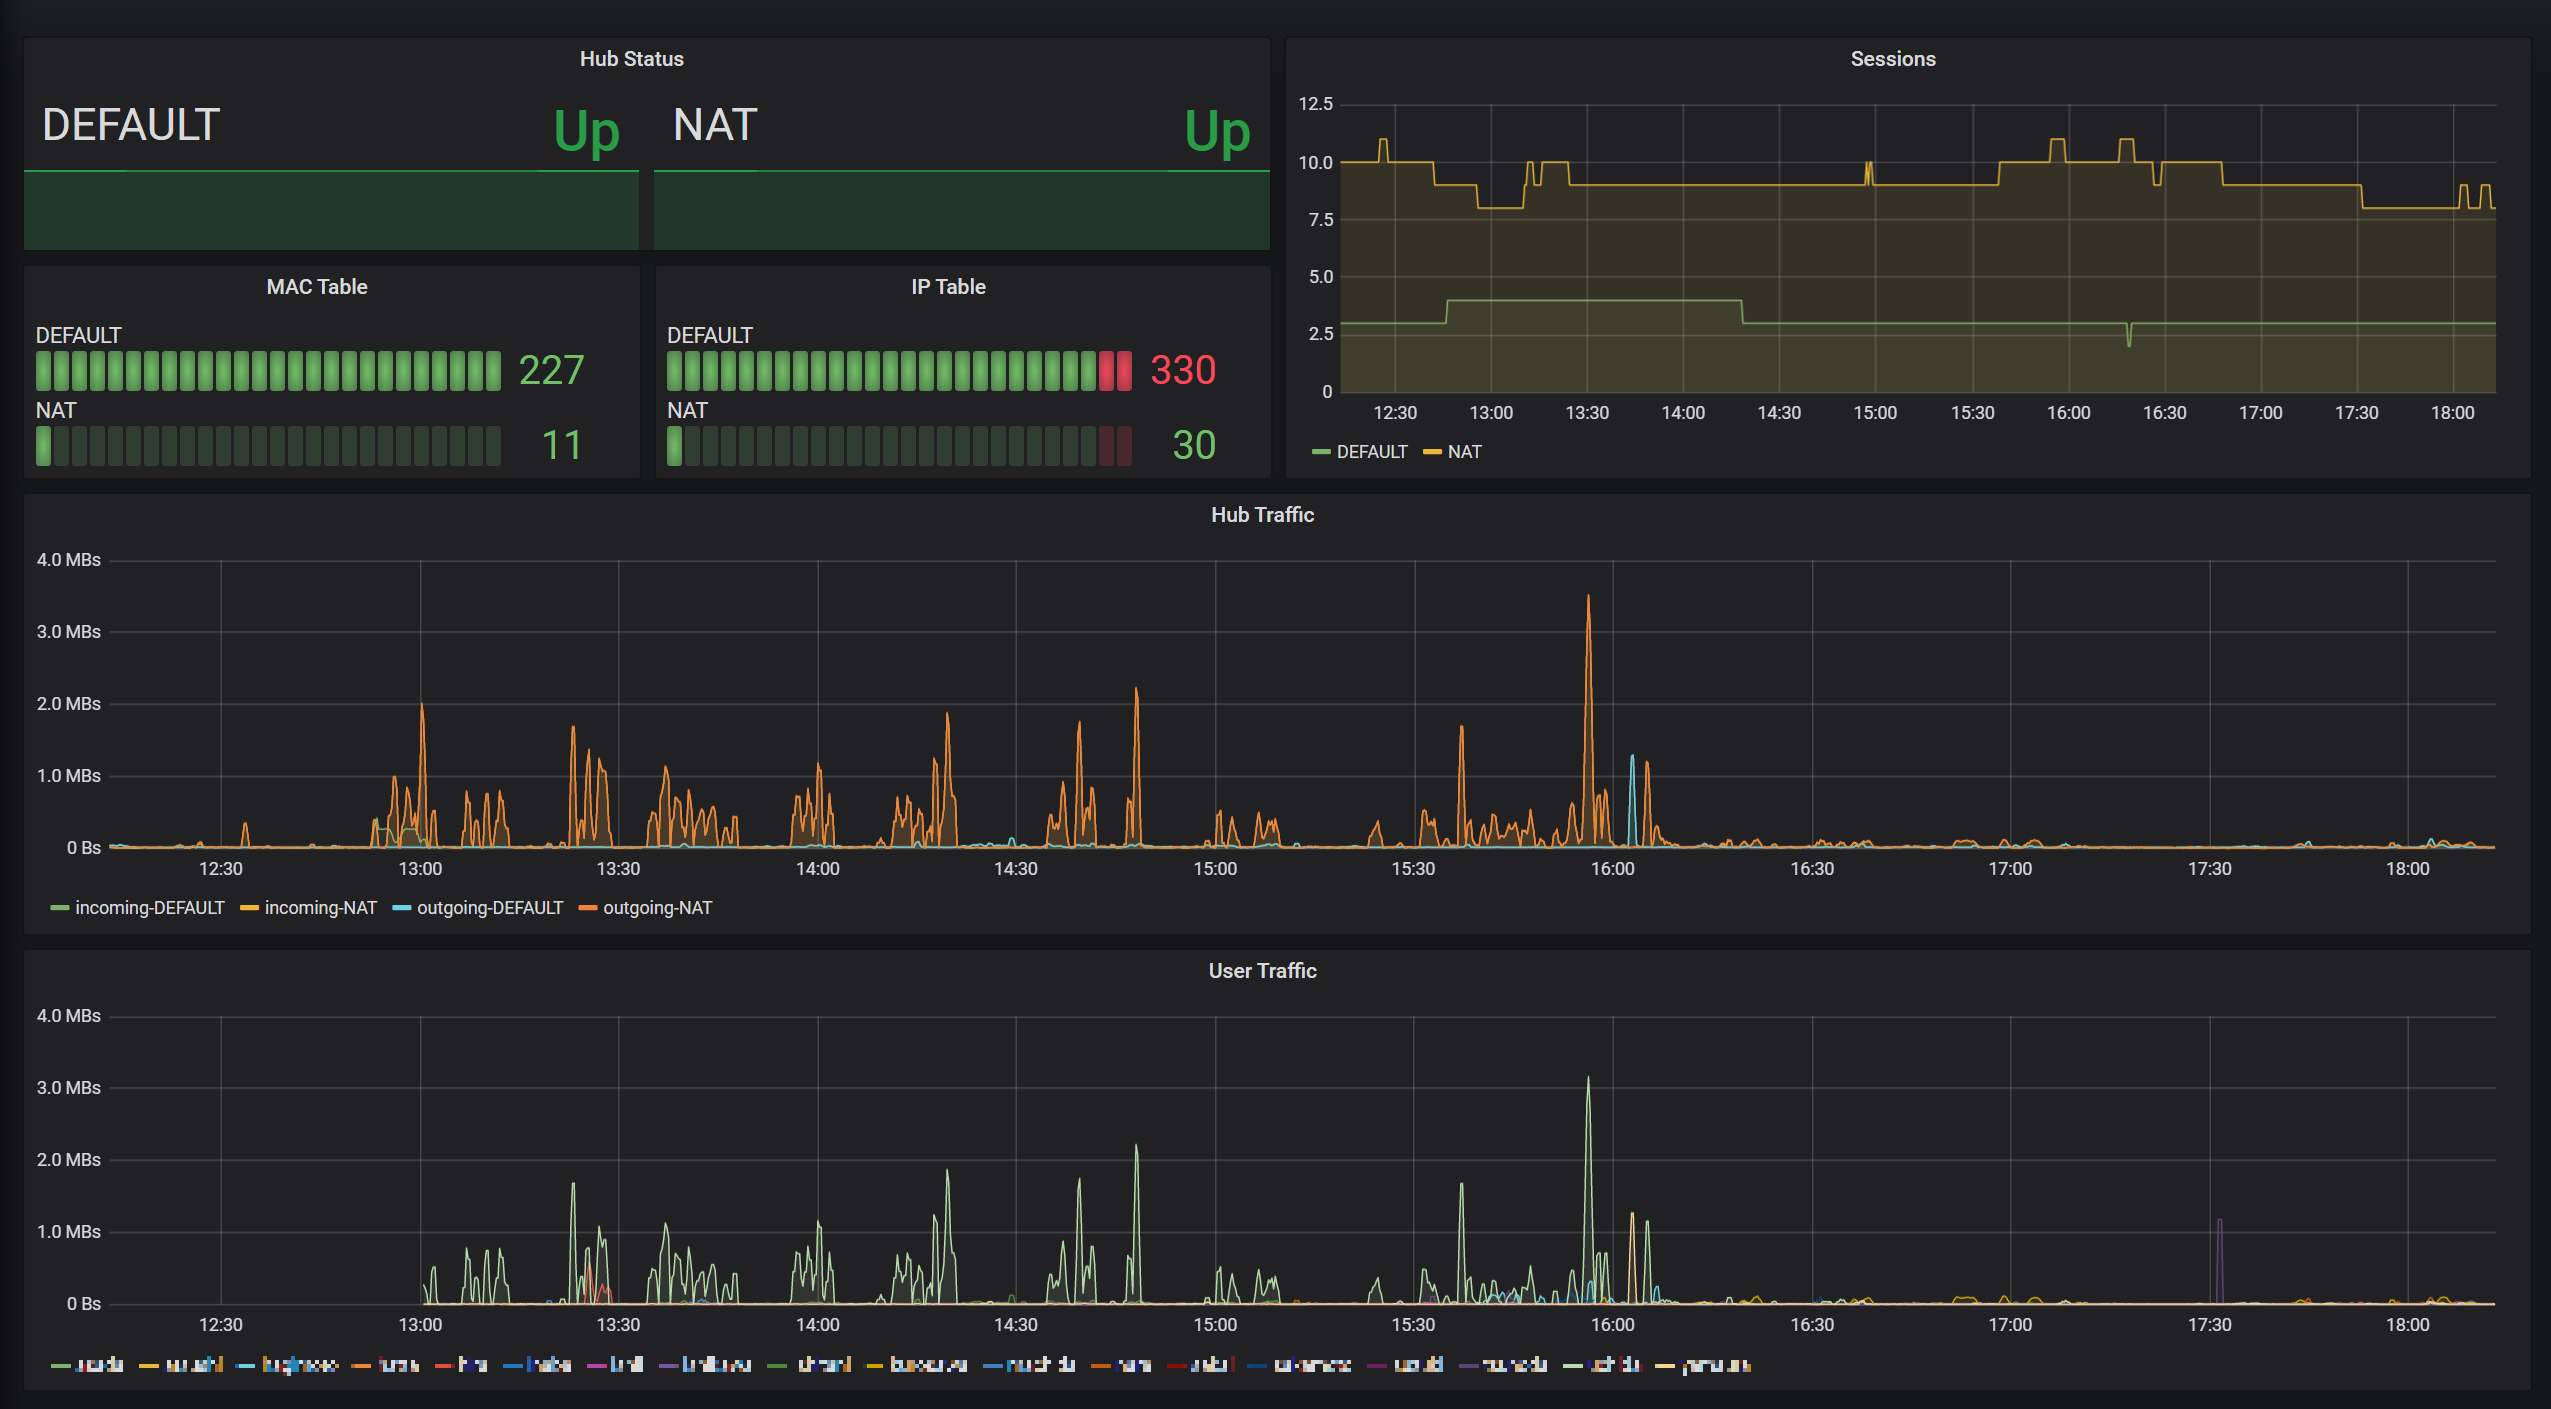
Grafanaを使って以下のようなダッシュボードを作ったり、Alertmanagerで死活監視をしたりすることができます。
この記事ではsoftether_exporterのセットアップとダッシュボードの作成を簡単に解説します。
PrometheusやGrafana自体の設定には触れないので他の記事を参照してください。
softether_exporterのセットアップ
以下からバイナリをダウンロードして適当な場所(ここでは/usr/local/binとします)に展開してください。
次にコンフィグファイル(場所は任意ですがここでは/etc/prometheus/softether.tomlとします)を用意します。
vpncmd = "/usr/local/vpnserver/vpncmd"
server = "localhost:8888"

[[hubs]]
name = "HUB1"
password = "xxx"

[[hubs]]
name = "HUB2"
password = "xxx"
vpncmdはSoftEther VPNのサーバと一緒に配布されているコマンドラインツールで、そのバイナリへのパスを指定します。
serverはSoftEther VPNサーバが動いているサーバとポートです(ここではsoftether_exporterと同じサーバで動いている想定です)。
さらに各仮想ハブ毎に名前とアクセスパスワードを設定します。
また、systemdを使ってサービスとして起動するのが便利なので以下のファイルを作ります。
[Unit]
Description=Prometheus SoftEther Exporter
After=network.target

[Service]
ExecStart=/usr/local/bin/softether_exporter --config.file=/etc/prometheus/softether.toml
User=nobody

[Install]
WantedBy=multi-user.target
systemdのリロードとサービス起動します。
$ systemctl daemon-reload
$ systemctl enable softether-exporter
$ systemctl start softether-exporter
これでsoftether-exporterのセットアップは完了です。
適宜Prometheusサーバ側のスクレイピング設定を追加してください。
ダッシュボード
冒頭のスクリーンショットにあるダッシュボードは以下で公開しています。
Grafanaの"Import dashboard"から以下のURLを入れてdata sourceの設定だけすればOKです。