Juliaという言語がなかなか楽しいのですが、新しく触れる言語かつ解説もそこまで多くないため、つまづくところが多いです。
そこで初心者の備忘録として、トライアンドエラーで得た知識を書いていきます。内容は思いつき次第更新で。より良いやり方や認識間違いなどの突っ込み大歓迎です。
Plots 複数ヒストグラムの幅を揃えたい
事象
using Plots

data1 = rand(100) .+ 2
data2 = rand(100) .* 3 .+ 1

plt = plot()
histogram!(plt, data1, alpha=0.3, bins=20)
histogram!(plt, data2, alpha=0.3, bins=20)
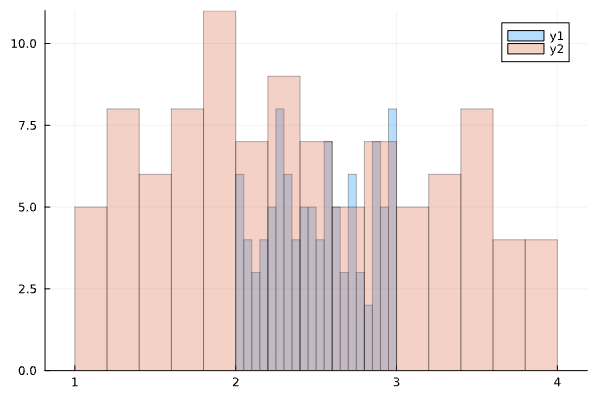
matplotlibでもありがちだけど、分散や最大最小値が異なる二つの分布を重ねると棒の幅などが揃わず、コレジャナイ感満載のヒストグラムができやすい。
解決策
StatsBaseのfit関数を使う。
あらかじめPkgからadd StatsBaseしておく。
using Plots
using StatsBase

data1 = rand(100) .+ 2
data2 = rand(100) .* 3 .+ 1

hist1 = fit(Histogram, data1, 0:0.2:5)
hist2 = fit(Histogram, data2, 0:0.2:5)

plt = plot()
plot!(hist1, alpha=0.3)
plot!(hist2, alpha=0.3)
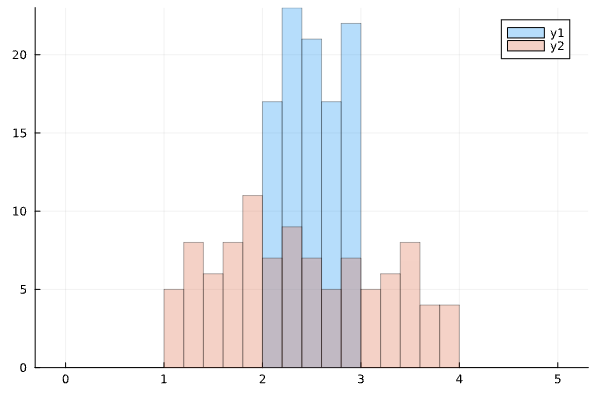
fitの第1引数はHistogram固定。第3引数にヒストグラムの最小値:差分:最大値を指定する。
これでhist1, hist2は度数分布表になるので、これをplotやplot!に放り込んでやる。
より良い方法
…と書いたところ、別に新たなパッケージを導入せずとも、binsにRangeを指定することでのぞみのグラフが得られるとコメントいただきました(ありがとうございます)。
using Plots

data1 = rand(100) .+ 2
data2 = rand(100) .* 3 .+ 1

plt = plot()
histogram!(plt, data1, alpha=0.3, bins=1:0.2:4)
histogram!(plt, data2, alpha=0.3, bins=1:0.2:4)
こっちの方がずっとスッキリ。
予定
- Plotのforを使った重ね書き
- Vectorを重ねてMatrixを作るときのお作法
- XLSXやCSV,Encode周り
- 型の扱い
- 入れておきたいパッケージ

