このノートは、KaggleのFreesound General-Purpose Audio Tagging Challengeから、Zafarさんに許諾いただき「Beginner's Guide to Audio Data」を(基本的に)翻訳したものです。
Kaggleに参加している人は、ぜひ元のカーネル「Beginner's Guide to Audio Data」に一票投じて下さいね。
オリジナルとの違い:
- 補足を各所に補いました。
-
sklearn.cross_validation.StratifiedKFoldは無くなるため、sklearn.model_selection.StratifiedKFoldにコードを数か所書き換えました。 - kaggleからデータをダウンロードしてきたフォルダを
DATADIRにセットした状態で始められるようにしました。
「Freesoundはクリエイティブ・コモンズ・ライセンスのサンプリング用音源を提供しているウェブサイトである。 野外音響からシンセサイザーを用いた効果音まで多様な音源が登録されている。」(Wikipediaより)
コンペティションの目標は、楽器、人間、動物、機械、その他実世界のさまざまな音を分類です。ラベルの一部を紹介すると、トランペット、Squeak (キュッキュッときしむ音)、猫の鳴き声、喝采、指鳴らしなどです。課題の一つとして、全てのラベルが手作業で確認されているわけではないことが挙げられます。これらの弱いアノテーションに部分的を絶妙に使った、クリエイティブな解決が求められます。
それではこの記事を通じて、データ可視化とモデル構築を見ていきましょう。気に入ったらVoteしてね(Beginner's Guide to Audio Dataのリンク先でどうぞ)! Happy Kaggling!
# 準備: 時間がかかるものを実行しないようにしています。再現したい人はTrueにセットして下さい。
COMPLETE_RUN = False

# 準備: 依存しているものの読み込み
import warnings
warnings.simplefilter('ignore')
import numpy as np
np.warnings.filterwarnings('ignore')
np.random.seed(1001)

import os
import shutil

import IPython
import matplotlib
import matplotlib.pyplot as plt
import pandas as pd
import seaborn as sns
from tqdm import tqdm_notebook
from sklearn.model_selection import StratifiedKFold

%matplotlib inline
matplotlib.style.use('ggplot')
1. データの分析
データセットの準備
以後、事前にコンペティションのデータセットをダウンロードした状態で説明します。
$ kaggle competitions download -c freesound-audio-tagging
データをロードする
DATADIR = os.path.join(os.path.expanduser('~'), '.kaggle/competitions/freesound-audio-tagging')

train = pd.read_csv(os.path.join(DATADIR, 'train.csv'))
test = pd.read_csv(os.path.join(DATADIR, 'sample_submission.csv'))

# 先頭、総数、ラベルを可視化
train.head()

print("Number of training examples=", train.shape[0], "  Number of classes=", len(train.label.unique()))
# Number of training examples= 9473   Number of classes= 41

print(train.label.unique())
# ['Hi-hat' 'Saxophone' 'Trumpet' 'Glockenspiel' 'Cello' 'Knock'
# 'Gunshot_or_gunfire' 'Clarinet' 'Computer_keyboard' 'Keys_jangling'
# 'Snare_drum' 'Writing' 'Laughter' 'Tearing' 'Fart' 'Oboe' 'Flute' 'Cough'
# 'Telephone' 'Bark' 'Chime' 'Bass_drum' 'Bus' 'Squeak' 'Scissors'
# 'Harmonica' 'Gong' 'Microwave_oven' 'Burping_or_eructation' 'Double_bass'
# 'Shatter' 'Fireworks' 'Tambourine' 'Cowbell' 'Electric_piano' 'Meow'
# 'Drawer_open_or_close' 'Applause' 'Acoustic_guitar' 'Violin_or_fiddle'
# 'Finger_snapping']
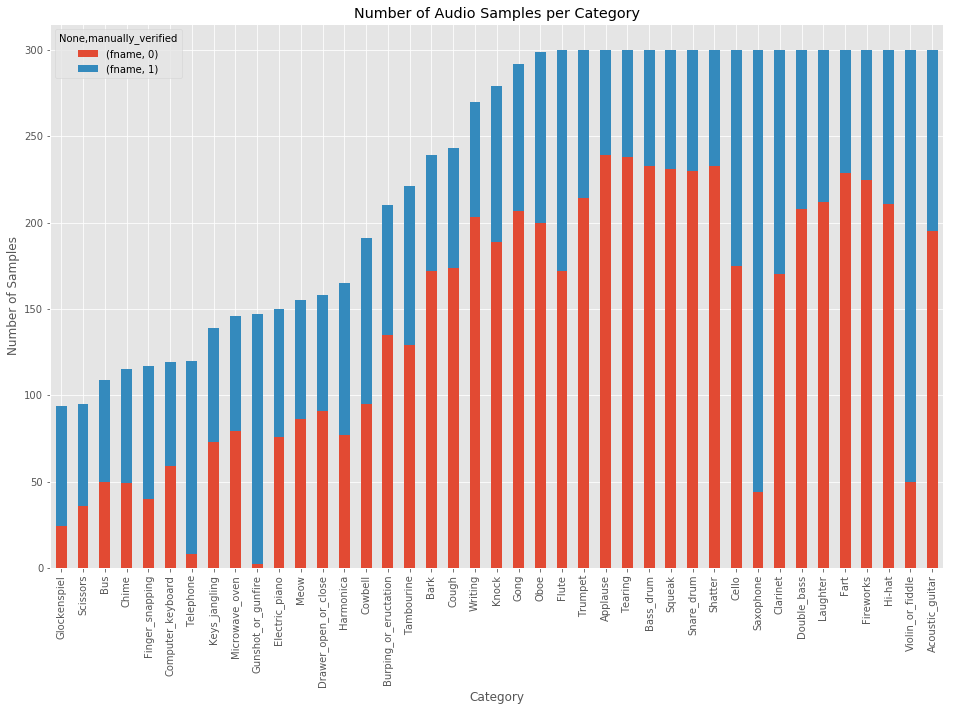
カテゴリーの分布を可視化
# ※やや時間がかかります
category_group = train.groupby(['label', 'manually_verified']).count()
plot = category_group.unstack().reindex(category_group.unstack().sum(axis=1).sort_values().index)\
          .plot(kind='bar', stacked=True, title="Number of Audio Samples per Category", figsize=(16,10))
plot.set_xlabel("Category")
plot.set_ylabel("Number of Samples");
print('Minimum samples per category = ', min(train.label.value_counts()))
print('Maximum samples per category = ', max(train.label.value_counts()))
# Minimum samples per category =  94
# Maximum samples per category =  300
ここまで確認できたのは:
- カテゴリーごとのオーディオサンプル数は不均一だということ。最小のオーディオサンプル数94に対して、最大は300。
- カテゴリーごとの
maually_verifiedラベルの数も不均一。
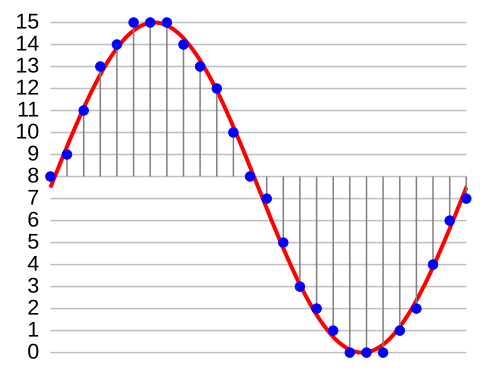
さて、オーディオファイルは16ビット幅44.1kHzサンプリングレートのPCM(パルス符号変調)です。
- ビット幅 = 16: オーディオの全てのサンプルの振幅は、2^16 (=65536)のうちとり得る値の一つになる。
- サンプリングレート = 44.1kHz: 1秒のオーディオデータは、44100サンプル。例えば3.2秒の音は、44100*3.2 = 141120の値を持つ。
それでは、データセットから一つの音を聞いてみて、numpy配列に変換しましょう。
import IPython.display as ipd  # 音声をJupyter notebookで再生するため
fname = os.path.join(DATADIR, 'audio_train', '00044347.wav')   # Hi-hat
ipd.Audio(fname)
# Jupyterだと再生ボタンが現れます

# ライブラリ wave を使う
import wave
wav = wave.open(fname)
print("Sampling (frame) rate = ", wav.getframerate())
print("Total samples (frames) = ", wav.getnframes())
print("Duration = ", wav.getnframes()/wav.getframerate())
# Sampling (frame) rate =  44100
# Total samples (frames) =  617400
# Duration =  14.0

# scipy を使う
from scipy.io import wavfile
rate, data = wavfile.read(fname)
print("Sampling (frame) rate = ", rate)
print("Total samples (frames) = ", data.shape)
print(data)
# Sampling (frame) rate =  44100
# Total samples (frames) =  (617400,)
# [ 0 26 -5 ...,  1  0  0]

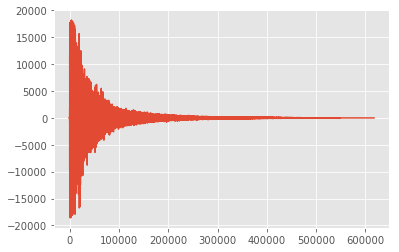
# 波形を可視化してみます。
plt.plot(data, '-', );
# 最初の500サンプルにズームしてみます。
plt.figure(figsize=(16, 4))
plt.plot(data[:500], '.'); plt.plot(data[:500], '-');
オーディオデータの長さ
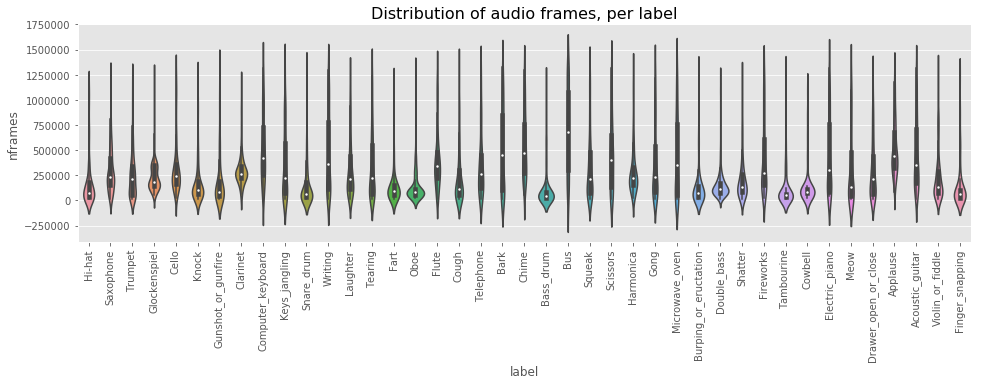
データセットのオーディオデータの長さを調べてみましょう。
train['nframes'] = train['fname'].apply(lambda f: wave.open(DATADIR+'/audio_train/' + f).getnframes())
test['nframes'] = test['fname'].apply(lambda f: wave.open(DATADIR+'/audio_test/' + f).getnframes())

_, ax = plt.subplots(figsize=(16, 4))
sns.violinplot(ax=ax, x="label", y="nframes", data=train)
plt.xticks(rotation=90)
plt.title('Distribution of audio frames, per label', fontsize=16)
plt.show()
観察できたのは:
- ラベルごとのオーディオデータ長の分布は不均一で、分散ばらつきが大きい。
ではTrainとTestの長さの分布を分析します。
fig, axes = plt.subplots(nrows=1, ncols=2, figsize=(16,5))
train.nframes.hist(bins=100, ax=axes[0])
test.nframes.hist(bins=100, ax=axes[1])
plt.suptitle('Frame Length Distribution in Train and Test', ha='center', fontsize='large');
ここで観察できたのは:
- 殆どのオーディオファイルは短い。
- Testには4つの異常な長さのものがある。これを見てみましょう。
def disp_audio_file_stats(abnormal_length):
    for length in abnormal_length:
        abnormal_fnames = test.loc[test.nframes == length, 'fname'].values
        print("Frame length = ", length, " Number of files = ", abnormal_fnames.shape[0], end="   ")
        fname = np.random.choice(abnormal_fnames)
        print("Playing ", fname)
        IPython.display.display(ipd.Audio( DATADIR + '/audio_test/' + fname))
disp_audio_file_stats([707364, 353682])
disp_audio_file_stats([138474, 184338])
# Jupyter上では4つの音声が聞けます。
(楽器音でしたね)
2. Raw波形を使ったモデルの構築
ここでは2つのモデルを作ります。
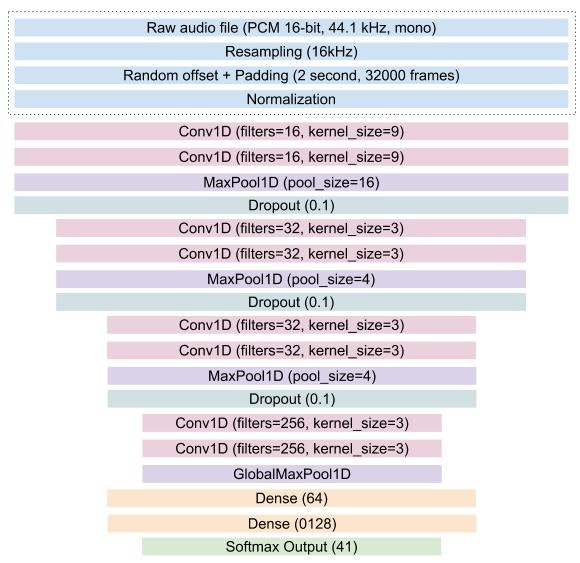
- 一つ目はRaw波形(1次元配列)を入力とし、Conv1Dを主な演算処理とするモデル。
- 二つ目はMFCC(後述)を入力とするモデル。
Raw波形を使ったKerasモデル
このモデルは次ような構造です。
Kaggleカーネルでの制限
Kaggleカーネルの時間制限で大きなモデルの10-fold学習ができません。ローカルに学習したものの出力をここにアップロードしています。
可能な場合はこのノートの先頭でCOMPLETE_RUN = Trueとして下さい。
# 準備: 必要なimport

import librosa
import numpy as np
import scipy
from keras import losses, models, optimizers
from keras.activations import relu, softmax
from keras.callbacks import (EarlyStopping, LearningRateScheduler,
                             ModelCheckpoint, TensorBoard, ReduceLROnPlateau)
from keras.layers import (Convolution1D, Dense, Dropout, GlobalAveragePooling1D,
                          GlobalMaxPool1D, Input, MaxPool1D, concatenate)
from keras.utils import Sequence, to_categorical
構成
構成(Configuration)オブジェクトに学習パラメーターを保持し、生成器、モデル、学習関数の間で共有します。
グローバルに学習に関係するものは全てConfigurationオブジェクトの一部とします。
class Config(object):
    def __init__(self,
                 sampling_rate=16000, audio_duration=2, n_classes=41,
                 use_mfcc=False, n_folds=10, learning_rate=0.0001,
                 max_epochs=50, n_mfcc=20):
        self.sampling_rate = sampling_rate
        self.audio_duration = audio_duration
        self.n_classes = n_classes
        self.use_mfcc = use_mfcc
        self.n_mfcc = n_mfcc
        self.n_folds = n_folds
        self.learning_rate = learning_rate
        self.max_epochs = max_epochs

        self.audio_length = self.sampling_rate * self.audio_duration
        if self.use_mfcc:
            self.dim = (self.n_mfcc, 1 + int(np.floor(self.audio_length/512)), 1)
        else:
            self.dim = (self.audio_length, 1)
データ生成クラス
DataGeneratorクラスはkeras.utils.Sequenceを継承することで、データを前処理してKerasモデルに与えるのに便利です。
- batch_sizeで初期化されると、epochあたりのバッチ数を計算します。
__len__メソッドで、いくつのバッチを引き出せば一つのepochになるかをKerasに伝えます。 - バッチ番号のindexを引数に取る
__getitem__は、オフセットを計算してデータ(Xとy)をバッチで返します。Test時は、Xだけが返ります。 - それぞれのepochの後に何かを行いたいとき(データをシャッフルしたり、データ拡張の比率を増やしたり)、
on_epoch_endを使えます。
メモ: Sequenceを使えば安全にマルチプロセスで処理できます。一回のepochでそれぞれのサンプルが一度だけネットワークに学習されることを保証してくれますが、これはGeneratorでは保証されていないことです。
class DataGenerator(Sequence):
    def __init__(self, config, data_dir, list_IDs, labels=None,
                 batch_size=64, preprocessing_fn=lambda x: x):
        self.config = config
        self.data_dir = data_dir
        self.list_IDs = list_IDs
        self.labels = labels
        self.batch_size = batch_size
        self.preprocessing_fn = preprocessing_fn
        self.on_epoch_end()
        self.dim = self.config.dim

    def __len__(self):
        return int(np.ceil(len(self.list_IDs) / self.batch_size))

    def __getitem__(self, index):
        indexes = self.indexes[index*self.batch_size:(index+1)*self.batch_size]
        list_IDs_temp = [self.list_IDs[k] for k in indexes]
        return self.__data_generation(list_IDs_temp)

    def on_epoch_end(self):
        self.indexes = np.arange(len(self.list_IDs))

    def __data_generation(self, list_IDs_temp):
        cur_batch_size = len(list_IDs_temp)
        X = np.empty((cur_batch_size, *self.dim))

        input_length = self.config.audio_length
        for i, ID in enumerate(list_IDs_temp):
            file_path = self.data_dir + ID

            # Read and Resample the audio
            data, _ = librosa.core.load(file_path, sr=self.config.sampling_rate,
                                        res_type='kaiser_fast')

            # Random offset / Padding
            if len(data) > input_length:
                max_offset = len(data) - input_length
                offset = np.random.randint(max_offset)
                data = data[offset:(input_length+offset)]
            else:
                if input_length > len(data):
                    max_offset = input_length - len(data)
                    offset = np.random.randint(max_offset)
                else:
                    offset = 0
                data = np.pad(data, (offset, input_length - len(data) - offset), "constant")

            # Normalization + Other Preprocessing
            if self.config.use_mfcc:
                data = librosa.feature.mfcc(data, sr=self.config.sampling_rate,
                                                   n_mfcc=self.config.n_mfcc)
                data = np.expand_dims(data, axis=-1)
            else:
                data = self.preprocessing_fn(data)[:, np.newaxis]
            X[i,] = data

        if self.labels is not None:
            y = np.empty(cur_batch_size, dtype=int)
            for i, ID in enumerate(list_IDs_temp):
                y[i] = self.labels[ID]
            return X, to_categorical(y, num_classes=self.config.n_classes)
        else:
            return X
正規化
正規化 (Normalization) は必要不可欠な前処理です。最も簡単な方法は、特徴量の範囲を[0, 1]に収めることです。
def audio_norm(data):
    max_data = np.max(data)
    min_data = np.min(data)
    data = (data-min_data)/(max_data-min_data+1e-6)
    return data-0.5
- 以下、get_1d_dummy_modelはダミーで、この記事の解説用です。
- 1D Conv modelはまあまあディープで、学習率0.0001でAdam最適化します。
def get_1d_dummy_model(config):

    nclass = config.n_classes
    input_length = config.audio_length

    inp = Input(shape=(input_length,1))
    x = GlobalMaxPool1D()(inp)
    out = Dense(nclass, activation=softmax)(x)

    model = models.Model(inputs=inp, outputs=out)
    opt = optimizers.Adam(config.learning_rate)

    model.compile(optimizer=opt, loss=losses.categorical_crossentropy, metrics=['acc'])
    return model

def get_1d_conv_model(config):

    nclass = config.n_classes
    input_length = config.audio_length

    inp = Input(shape=(input_length,1))
    x = Convolution1D(16, 9, activation=relu, padding="valid")(inp)
    x = Convolution1D(16, 9, activation=relu, padding="valid")(x)
    x = MaxPool1D(16)(x)
    x = Dropout(rate=0.1)(x)

    x = Convolution1D(32, 3, activation=relu, padding="valid")(x)
    x = Convolution1D(32, 3, activation=relu, padding="valid")(x)
    x = MaxPool1D(4)(x)
    x = Dropout(rate=0.1)(x)

    x = Convolution1D(32, 3, activation=relu, padding="valid")(x)
    x = Convolution1D(32, 3, activation=relu, padding="valid")(x)
    x = MaxPool1D(4)(x)
    x = Dropout(rate=0.1)(x)

    x = Convolution1D(256, 3, activation=relu, padding="valid")(x)
    x = Convolution1D(256, 3, activation=relu, padding="valid")(x)
    x = GlobalMaxPool1D()(x)
    x = Dropout(rate=0.2)(x)

    x = Dense(64, activation=relu)(x)
    x = Dense(1028, activation=relu)(x)
    out = Dense(nclass, activation=softmax)(x)

    model = models.Model(inputs=inp, outputs=out)
    opt = optimizers.Adam(config.learning_rate)

    model.compile(optimizer=opt, loss=losses.categorical_crossentropy, metrics=['acc'])
    return model
1D Conv (1次元配列畳み込み) モデルの学習
ラベルを数値のindexに変換します。
LABELS = list(train.label.unique())
label_idx = {label: i for i, label in enumerate(LABELS)}
train.set_index("fname", inplace=True)
test.set_index("fname", inplace=True)
train["label_idx"] = train.label.apply(lambda x: label_idx[x])
if not COMPLETE_RUN:
    train = train[:2000]
    test = test[:2000]

config = Config(sampling_rate=16000, audio_duration=2, n_folds=10, learning_rate=0.001)
if not COMPLETE_RUN:
    config = Config(sampling_rate=100, audio_duration=1, n_folds=2, max_epochs=1)
以下、10-fold学習のコードです:
-
sklearn.model_selection.StratifiedKFoldを使い、学習データを10組に分割します。 - いくつかのKerasコールバックを使って学習をモニタリングします。
-
ModelCheckpointは検証(validation)データの結果が一番いいモデルのweightを保存します。このweightを使ってTestの予測を行います。 -
EarlyStoppingは検証lossが減少しなくなったら学習を終了させます。 -
TensorBoardは学習と検証のlossとaccuracyを可視化してくれます。
-
- 学習及び検証用に分割されたデータに対して
DataGeneratorを使い、モデルを学習させます。 - 学習とテスト両方の予測結果を得ると、.npyフォーマットで保存します。またsubmissionファイルも生成します。10-fold CV(クロスバリデーション)により、10個の予測ファイルができますので、これをのちほどアンサンブルします。
# 学習にものすごく時間がかかります。GTX1080を使って、およそ12時間…
PREDICTION_FOLDER = "predictions_1d_conv"
if not os.path.exists(PREDICTION_FOLDER):
    os.mkdir(PREDICTION_FOLDER)
if os.path.exists('logs/' + PREDICTION_FOLDER):
    shutil.rmtree('logs/' + PREDICTION_FOLDER)

skf = StratifiedKFold(n_splits=config.n_folds).split(train, train.label_idx)

for i, (train_split, val_split) in enumerate(skf):
    train_set = train.iloc[train_split]
    val_set = train.iloc[val_split]
    checkpoint = ModelCheckpoint('best_%d.h5'%i, monitor='val_loss', verbose=1, save_best_only=True)
    early = EarlyStopping(monitor="val_loss", mode="min", patience=5)
    tb = TensorBoard(log_dir='./logs/' + PREDICTION_FOLDER + '/fold_%d'%i, write_graph=True)

    callbacks_list = [checkpoint, early, tb]
    print("Fold: ", i)
    print("#"*50)
    if COMPLETE_RUN:
        model = get_1d_conv_model(config)
    else:
        model = get_1d_dummy_model(config)

    train_generator = DataGenerator(config, os.path.join(DATADIR, 'audio_train/'), train_set.index,
                                    train_set.label_idx, batch_size=64,
                                    preprocessing_fn=audio_norm)
    val_generator = DataGenerator(config, os.path.join(DATADIR, 'audio_train/'), val_set.index,
                                  val_set.label_idx, batch_size=64,
                                  preprocessing_fn=audio_norm)

    history = model.fit_generator(train_generator, callbacks=callbacks_list, validation_data=val_generator,
                                  epochs=config.max_epochs, use_multiprocessing=True, workers=6, max_queue_size=20)

    model.load_weights('best_%d.h5'%i)

    # Save train predictions
    train_generator = DataGenerator(config, os.path.join(DATADIR, 'audio_train/'), train.index, batch_size=128,
                                    preprocessing_fn=audio_norm)
    predictions = model.predict_generator(train_generator, use_multiprocessing=True,
                                          workers=6, max_queue_size=20, verbose=1)
    np.save(PREDICTION_FOLDER + "/train_predictions_%d.npy"%i, predictions)

    # Save test predictions
    test_generator = DataGenerator(config, os.path.join(DATADIR, 'audio_test/'), test.index, batch_size=128,
                                    preprocessing_fn=audio_norm)
    predictions = model.predict_generator(test_generator, use_multiprocessing=True,
                                          workers=6, max_queue_size=20, verbose=1)
    np.save(PREDICTION_FOLDER + "/test_predictions_%d.npy"%i, predictions)

    # Make a submission file
    top_3 = np.array(LABELS)[np.argsort(-predictions, axis=1)[:, :3]]
    predicted_labels = [' '.join(list(x)) for x in top_3]
    test['label'] = predicted_labels
    test[['label']].to_csv(PREDICTION_FOLDER + "/predictions_%d.csv"%i)
1D Conv 予測結果のアンサンブル
モデルを学習しましたので、10-foldの予測を平均しましょう。パブリックLB(Kaggleのリーダーボード)で使われる幾何平均(Geometric Mean) を行います。
pred_list = []
for i in range(10):
    pred_list.append(np.load(os.path.join(PREDICTION_FOLDER, "test_predictions_%d.npy"%i)))
prediction = np.ones_like(pred_list[0])
for pred in pred_list:
    prediction = prediction*pred
prediction = prediction**(1./len(pred_list))
# Make a submission file
top_3 = np.array(LABELS)[np.argsort(-prediction, axis=1)[:, :3]]
predicted_labels = [' '.join(list(x)) for x in top_3]
test = pd.read_csv(os.path.join(DATADIR, 'sample_submission.csv'))
test['label'] = predicted_labels
test[['fname', 'label']].to_csv("1d_conv_ensembled_submission.csv", index=False)
3. MFCCの紹介
これまで見てきたように、ディープラーニングはRawなオーディオデータを使った分類すら可能です。複雑な特徴量のエンジニアリングが必要ないのです。
しかしディープラーニングの時代であっても、オーディオ信号から特徴量を抽出する手法は発達され続けています。つまり、未だに有効だからです。
その手法の一つとしてMFCC(メル周波数ケプストラム係数)の抽出があります。MFCCの説明の前に、音声からの特徴量抽出に少し触れましょう。
(例えば人の話している声に関して) 音の分類を行うとき、話者に依存しない特徴量を得たいでしょう。
話者の情報しか得られない特徴量(例えば声の高さ)は、分類には役立ちません。
言い換えると、話者の特性より、音声の「内容」に関連する特徴量を取り出すべきです。
また良い特徴量抽出手法は、人が会話を理解するやり方を真似ることです。人間は音量を線形に聞きません。
もし音を二倍に知覚したい場合、音に8倍のエネルギーを与えることになります。線形に聞く代わりに、人間は対数スケールで知覚します。
これらを考慮して、DavisとMermelsteinは1980年にMFCCを考案しました。
MFCCは対数で音量と音程を知覚する人間の聴覚システムの仕組みを真似て、基本周波数(音程)とその倍音を除くことで、話者に依存する特徴を排除します。
基本となる数学はとても複雑なのでここでは割愛します。興味を持った方は、こちらでより詳しい説明をご覧ください。
Librosaを使ったMFCCの生成
ライブラリlibrosaはMFCCを計算する機能を持ちます。MFCCを計算して可視化してみましょう。
import librosa
SAMPLE_RATE = 44100
fname = os.path.join(DATADIR, 'audio_train', '00044347.wav')   # Hi-hat
wav, _ = librosa.core.load(fname, sr=SAMPLE_RATE)
wav = wav[:2*44100]

mfcc = librosa.feature.mfcc(wav, sr = SAMPLE_RATE, n_mfcc=40)
mfcc.shape
# (40, 173)
plt.imshow(mfcc, cmap='hot', interpolation='nearest');

MFCCを使ったモデルの構築
MFCCを使い、2D Convモデルを構築します。
from keras.layers import (Convolution2D, GlobalAveragePooling2D, BatchNormalization, Flatten,
                          GlobalMaxPool2D, MaxPool2D, concatenate, Activation)
from keras.utils import Sequence, to_categorical
from keras import backend as K

def get_2d_dummy_model(config):

    nclass = config.n_classes

    inp = Input(shape=(config.dim[0],config.dim[1],1))
    x = GlobalMaxPool2D()(inp)
    out = Dense(nclass, activation=softmax)(x)

    model = models.Model(inputs=inp, outputs=out)
    opt = optimizers.Adam(config.learning_rate)

    model.compile(optimizer=opt, loss=losses.categorical_crossentropy, metrics=['acc'])
    return model


def get_2d_conv_model(config):

    nclass = config.n_classes

    inp = Input(shape=(config.dim[0],config.dim[1],1))
    x = Convolution2D(32, (4,10), padding="same")(inp)
    x = BatchNormalization()(x)
    x = Activation("relu")(x)
    x = MaxPool2D()(x)

    x = Convolution2D(32, (4,10), padding="same")(x)
    x = BatchNormalization()(x)
    x = Activation("relu")(x)
    x = MaxPool2D()(x)

    x = Convolution2D(32, (4,10), padding="same")(x)
    x = BatchNormalization()(x)
    x = Activation("relu")(x)
    x = MaxPool2D()(x)

    x = Convolution2D(32, (4,10), padding="same")(x)
    x = BatchNormalization()(x)
    x = Activation("relu")(x)
    x = MaxPool2D()(x)

    x = Flatten()(x)
    x = Dense(64)(x)
    x = BatchNormalization()(x)
    x = Activation("relu")(x)
    out = Dense(nclass, activation=softmax)(x)

    model = models.Model(inputs=inp, outputs=out)
    opt = optimizers.Adam(config.learning_rate)

    model.compile(optimizer=opt, loss=losses.categorical_crossentropy, metrics=['acc'])
    return model
データの準備
config = Config(sampling_rate=44100, audio_duration=2, n_folds=10,
                learning_rate=0.001, use_mfcc=True, n_mfcc=40)
if not COMPLETE_RUN:
    config = Config(sampling_rate=44100, audio_duration=2, n_folds=2,
                    max_epochs=1, use_mfcc=True, n_mfcc=40)

def prepare_data(df, config, data_dir):
    X = np.empty(shape=(df.shape[0], config.dim[0], config.dim[1], 1))
    input_length = config.audio_length
    for i, fname in enumerate(df.index):
        print(fname)
        file_path = data_dir + fname
        data, _ = librosa.core.load(file_path, sr=config.sampling_rate, res_type="kaiser_fast")

        # Random offset / Padding
        if len(data) > input_length:
            max_offset = len(data) - input_length
            offset = np.random.randint(max_offset)
            data = data[offset:(input_length+offset)]
        else:
            if input_length > len(data):
                max_offset = input_length - len(data)
                offset = np.random.randint(max_offset)
            else:
                offset = 0
            data = np.pad(data, (offset, input_length - len(data) - offset), "constant")

        data = librosa.feature.mfcc(data, sr=config.sampling_rate, n_mfcc=config.n_mfcc)
        data = np.expand_dims(data, axis=-1)
        X[i,] = data
    return X

test.set_index("fname", inplace=True) # fnameを再びindex化しておく
X_train = prepare_data(train, config, os.path.join(DATADIR, 'audio_train/'))
X_test = prepare_data(test, config, os.path.join(DATADIR, 'audio_test/'))
y_train = to_categorical(train.label_idx, num_classes=config.n_classes)
正規化
mean = np.mean(X_train, axis=0)
std = np.std(X_train, axis=0)

X_train = (X_train - mean)/std
X_test = (X_test - mean)/std
MFCCでの2D Convモデルの学習
PREDICTION_FOLDER = "predictions_2d_conv"
if not os.path.exists(PREDICTION_FOLDER):
    os.mkdir(PREDICTION_FOLDER)
if os.path.exists('logs/' + PREDICTION_FOLDER):
    shutil.rmtree('logs/' + PREDICTION_FOLDER)

skf = StratifiedKFold(n_splits=config.n_folds).split(train, train.label_idx)
for i, (train_split, val_split) in enumerate(skf):
    K.clear_session()
    X, y, X_val, y_val = X_train[train_split], y_train[train_split], X_train[val_split], y_train[val_split]
    checkpoint = ModelCheckpoint('best_%d.h5'%i, monitor='val_loss', verbose=1, save_best_only=True)
    early = EarlyStopping(monitor="val_loss", mode="min", patience=5)
    tb = TensorBoard(log_dir='./logs/' + PREDICTION_FOLDER + '/fold_%i'%i, write_graph=True)
    callbacks_list = [checkpoint, early, tb]
    print("#"*50)
    print("Fold: ", i)
    model = get_2d_conv_model(config)
    history = model.fit(X, y, validation_data=(X_val, y_val), callbacks=callbacks_list,
                        batch_size=64, epochs=config.max_epochs)
    model.load_weights('best_%d.h5'%i)

    # Save train predictions
    predictions = model.predict(X_train, batch_size=64, verbose=1)
    np.save(PREDICTION_FOLDER + "/train_predictions_%d.npy"%i, predictions)

    # Save test predictions
    predictions = model.predict(X_test, batch_size=64, verbose=1)
    np.save(PREDICTION_FOLDER + "/test_predictions_%d.npy"%i, predictions)

    # Make a submission file
    top_3 = np.array(LABELS)[np.argsort(-predictions, axis=1)[:, :3]]
    predicted_labels = [' '.join(list(x)) for x in top_3]
    test['label'] = predicted_labels
    test[['label']].to_csv(PREDICTION_FOLDER + "/predictions_%d.csv"%i)
2D Conv モデル予測結果のアンサンブル
pred_list = []
for i in range(10):
    pred_list.append(np.load(os.path.join(PREDICTION_FOLDER, "test_predictions_%d.npy"%i)))
prediction = np.ones_like(pred_list[0])
for pred in pred_list:
    prediction = prediction*pred
prediction = prediction**(1./len(pred_list))
# Make a submission file
top_3 = np.array(LABELS)[np.argsort(-prediction, axis=1)[:, :3]]
predicted_labels = [' '.join(list(x)) for x in top_3]
test = pd.read_csv(os.path.join(DATADIR, 'sample_submission.csv'))
test['label'] = predicted_labels
test[['fname', 'label']].to_csv("2d_conv_ensembled_submission.csv", index=False)
5. 1D Conv と 2D Conv 予測結果のアンサンブル
pred_list = []
for i in range(10):
    pred_list.append(np.load("predictions_1d_conv/test_predictions_%d.npy"%i))
for i in range(10):
    pred_list.append(np.load("predictions_2d_conv/test_predictions_%d.npy"%i))
prediction = np.ones_like(pred_list[0])
for pred in pred_list:
    prediction = prediction*pred
prediction = prediction**(1./len(pred_list))
# Make a submission file
top_3 = np.array(LABELS)[np.argsort(-prediction, axis=1)[:, :3]]
predicted_labels = [' '.join(list(x)) for x in top_3]
test = pd.read_csv(os.path.join(DATADIR, 'sample_submission.csv'))
test['label'] = predicted_labels
test[['fname', 'label']].to_csv("1d_2d_ensembled_submission.csv", index=False)
結果とまとめ
これまで2つのモデルを学習しました。複雑さと強みを比較してみましょう。
| モデル | 学習パラメーター数 | Public LB スコア |
|---|---|---|
| 1D Conv on Raw wave | 360,513 | 0.809 |
| 2D Conv on MFCC (verified labels only) | 168,361 | 0.785 |
| 2D Conv on MFCC | 168,361 | 0.844 |
| 1D Conv + 2D Conv Ensemble | N/A | 0.895 |
以上のように、MFCCを使った2D Convモデルの方が、Rawデータを使った1D Convモデルより良い結果が得られています。
訳者補足: 学習時間も、MFCCでの2D Convモデルのほうが圧倒的に速いです。一度numpyデータ化してX_train/y_trainデータを直接model.fit()に渡すことができて、1D Convの学習実装のように毎回DataGeneratorでデータを読み込んで前処理するオーバーヘッドがないためでしょう。
今後の予定
- データ拡張
- 手作業で検証されたラベルでの学習
(以上、最後の方はまだ未完成みたいですね。元のカーネルが更新されたら更新します。)

