はじめに
本投稿では、CEKからExtensionを介して送られてきたユーザリクエストをQuickSightを利用して可視化を試します。
構成とフロー
- Endpointでユーザリクエストを丸ごとFirehoseへ放り込む
- FirehoseでS3にデータを溜める
- AthenaでS3のデータを吸い上げる
- AthenaをデータソースとしてQuickSightで可視化する
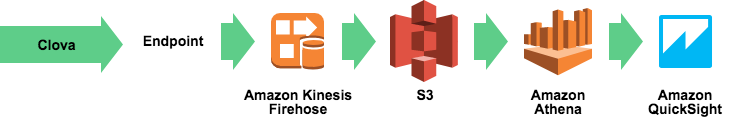
以上の構成を作成していきます!
前提条件
- Endpointには、API Gateway + Lambda を利用しています。
S3 Bucket の作成
Firehoseの入れ物(バケット)を作成します。
被らないようにExtensionIdなどを含めた名称で作成しましょう。
| バケット名 | 備考 |
|---|---|
| cek-stream-bucket-{exntensionId} | 任意 |
Amazon Kinesis Firehose の作成
ステップ順に以下の値を設定していきます。
ほぼデフォルトです。
Name and source
| 項目 | 設定値 |
|---|---|
| Delivery stream name | cek-stream |
| Source | Direct PUT or other sources |
Process records
| 項目 | 設定値 |
|---|---|
| Record transformation | Disabled |
| Record format conversion | Disabled |
Choose destination
| 項目 | 設定値 |
|---|---|
| Destination | Amazon S3 |
| S3 bucket | cek-stream-bucket-{exntensionId} |
| Prefix | (入力しない) |
Configure settings
S3 buffer conditions
| 項目 | 設定値 |
|---|---|
| Buffer size | 5 MB |
| Buffer interval | 300 seconds |
S3 compression and encryption
| 項目 | 設定値 |
|---|---|
| S3 compression | GZIP |
| S3 encryption | Disabled |
Error logging
| 項目 | 設定値 |
|---|---|
| Error logging | Enabled |
IAM Role
ロールが無い場合は新規作成してください。
| 項目 | 設定値 |
|---|---|
| ロール | firehose_delivery_role |
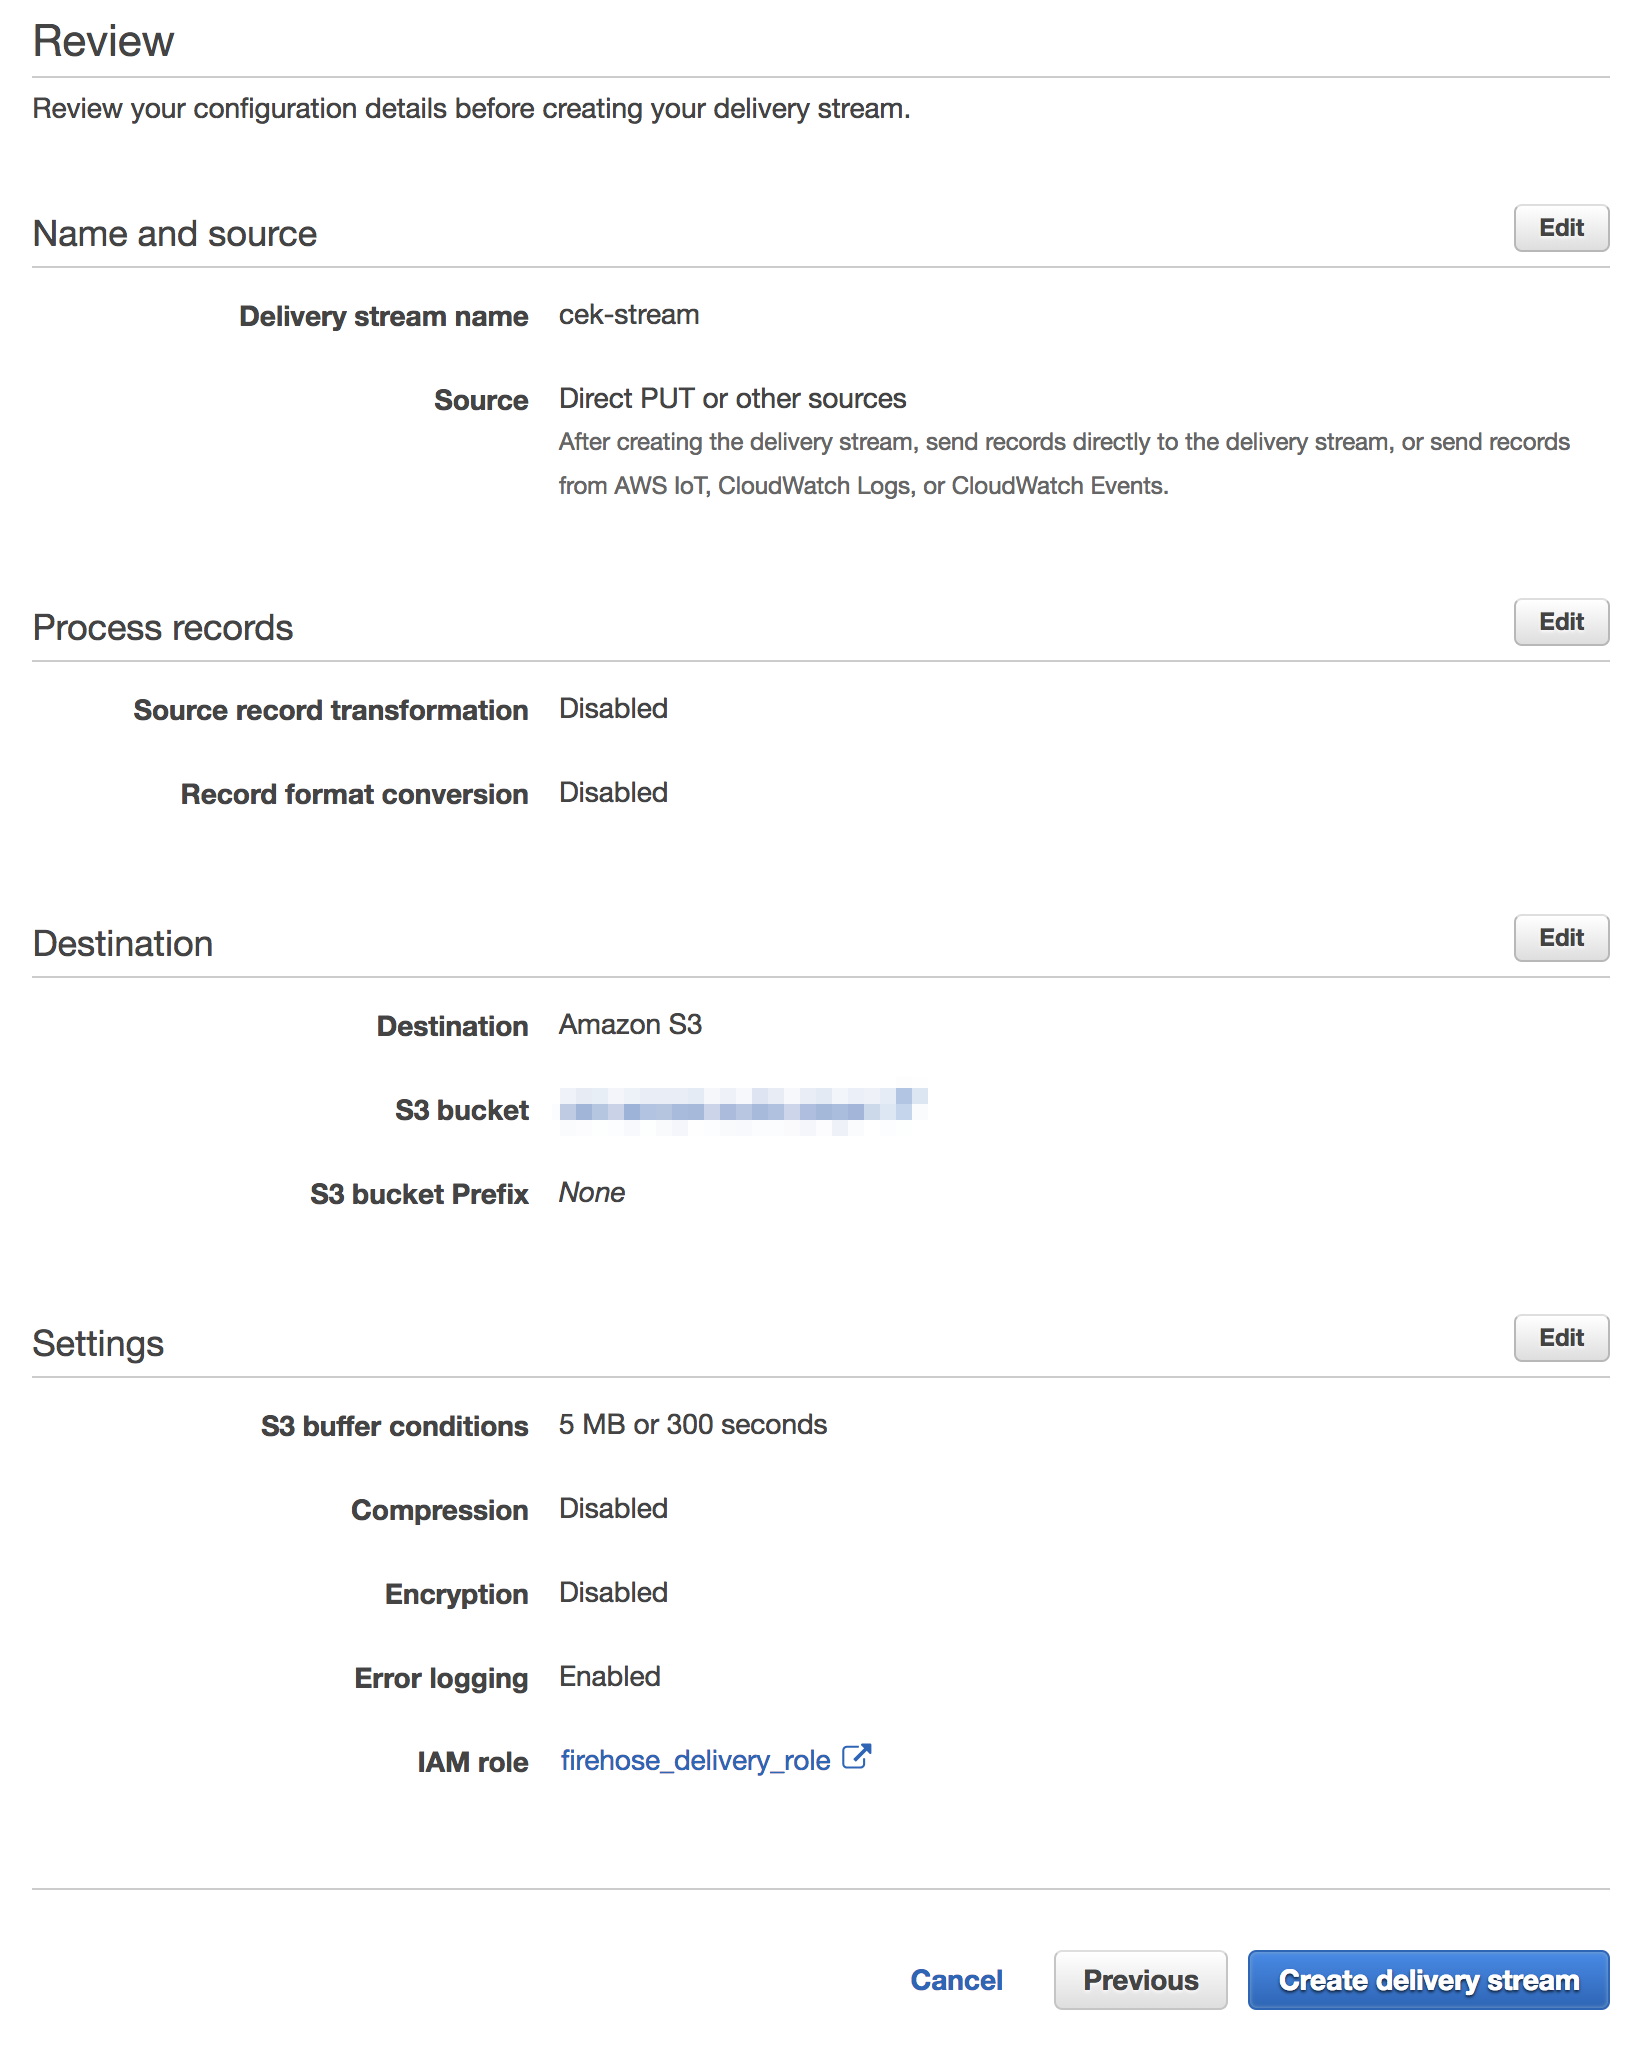
Review
以下の設定であることを確認して、作成!
テストデータを溜める
ここまで出来たら、Endpointの処理にユーザリクエストをFirehoseへ登録する処理を追加してください。
以下はサンプルです。
リクエスト本文をFirehoseへ登録します。
export const handler = async (
  event: Lambda.APIGatewayProxyEvent,
  context: Lambda.Context,
  callback: Lambda.APIGatewayProxyCallback
) => {
  const firehose = new AWS.Firehose({
    apiVersion: '2015-08-04',
    region: 'ap-northeast-1'
  });

  await firehose.putRecord(
    {
      DeliveryStreamName: 'cek-stream',
      Record: {
        Data: new Buffer(`${String(event.body)}\n`)
      }
    }
  ).promise();
何度か実行して、データを溜めておきましょう。
Athena の設定
QuickSightのデータソースとするため、Athenaの環境を作っていきます。
本投稿では、struct 型を利用するためウィザードからではなく、DDLを実行して以下の順で作成を行います。
- データベースの作成
- テーブルの作成
- ビューの作成
データベースの作成
CREATE DATABASE IF NOT EXISTS cek_stream_db;
テーブルの作成
ユーザリクエスト本文は以下のようなJSONになっています。
{
    "version": "1.0",
    "session": {
        "new": true,
        "sessionAttributes": {},
        "sessionId": "",
        "user": {
            "userId": ""
        }
    },
    "context": {
    },
    "request": {
        "type": "EventRequest",
        "requestId": "",
        "timestamp": "2018-08-08T00:00:00Z",
        "locale": "ja-JP",
        "extensionId": "",
        "intent": {
            "intent": "",
            "name": "",
            "slots": null
        },
        "event": {
            "namespace": "AudioPlayer",
            "name": "PlayStarted",
            "payload": {
            }
        }
    }
}
リクエスト本文に合わせて、DDLでJSONデータを宣言していきます。
CREATE EXTERNAL TABLE IF NOT EXISTS cek_stream_db.cek_requests (
  `version` string,
  `session` struct<sessionId: string, user: struct<userId: string, accessToken: string>, new: boolean>,
  `request` struct<type: string, requestId: string, timestamp: string, locale: string, extensionId: string, intent: struct<intent: string, name: string, slots: map<string, string>>, event: struct<namespace: string, name: string>>
)
ROW FORMAT SERDE 'org.openx.data.jsonserde.JsonSerDe'
WITH SERDEPROPERTIES (
  'serialization.format' = '1'
) LOCATION 's3://cek-stream-bucket-{exntensionId}/'
TBLPROPERTIES ('has_encrypted_data'='false');
ビューの作成
ここまでで、QuickSightのデータソースとしてAthenaを利用することが可能になりました。
が、QuickSightでは入れ子のデータを利用できないので必要な値を取得するビューを作成します。
CREATE OR REPLACE VIEW cek_stream_db.requests_view AS
SELECT
  "version",
  "session"."sessionid",
  "request"."type",
  "request"."timestamp",
  "request"."intent"."intent",
  "request"."intent"."name" "intentName",
  "request"."event"."namespace",
  "request"."event"."name" "eventName"
FROM
  cek_stream_db.cek_requests;
QuickSight
初期セットアップの手順は割愛します。
Athenaをデータソースとしグラフを作成していきます。
S3 読み取り権限の追加
QuickSight Account settings で、最初に作成したバケットの権限を追加します。
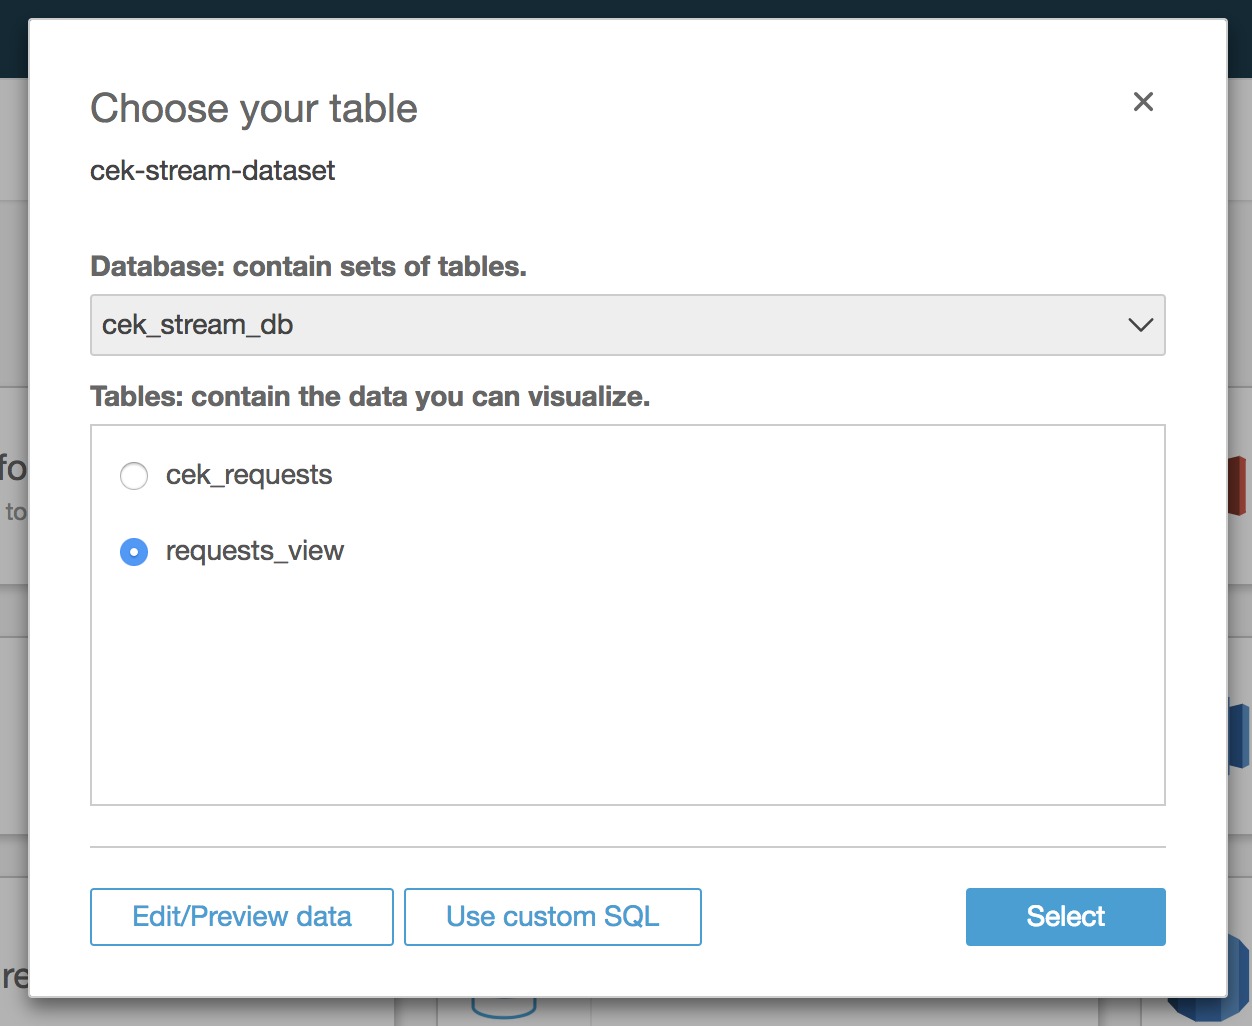
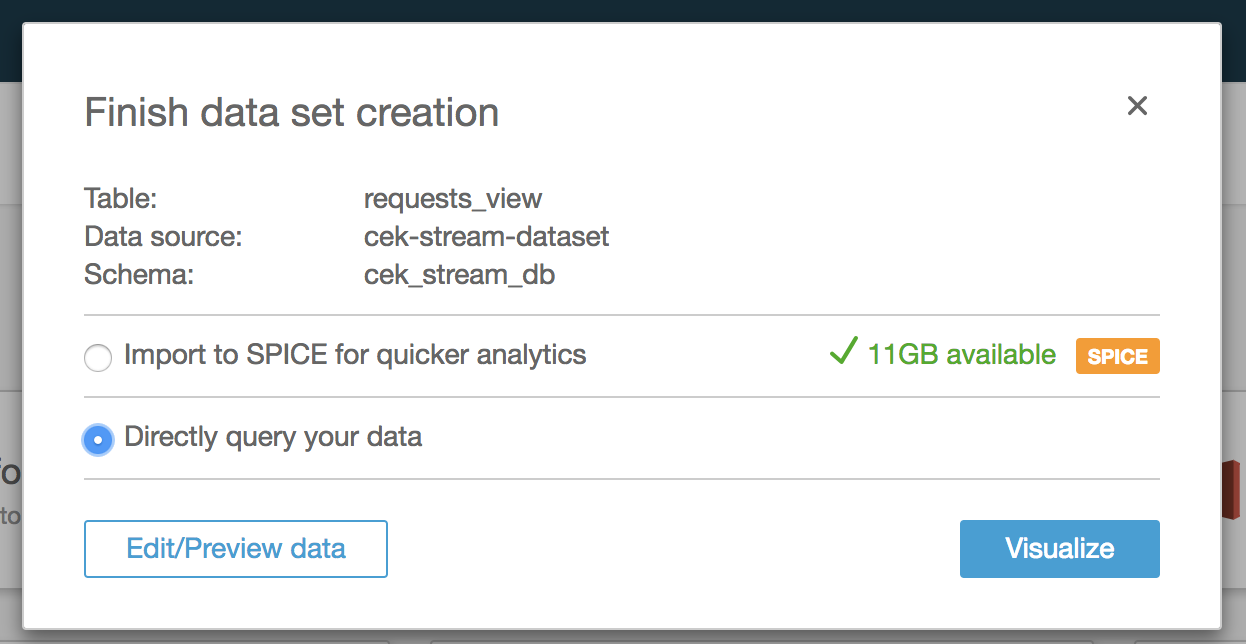
Data setsの作成
New data setを選択し、データソースにAthenaを選択します。
ウィザードに従って以下の設定値を入力します。
| 項目名 | 設定値 |
|---|---|
| Data Source name | cek-stream-dataset |
| Database | cek_stream_db |
| Tables | requests_view |
| Finish data set creation | Directly query your data |
analysis の作成
データセットの準備も出来たのでグラフを作成していきます!
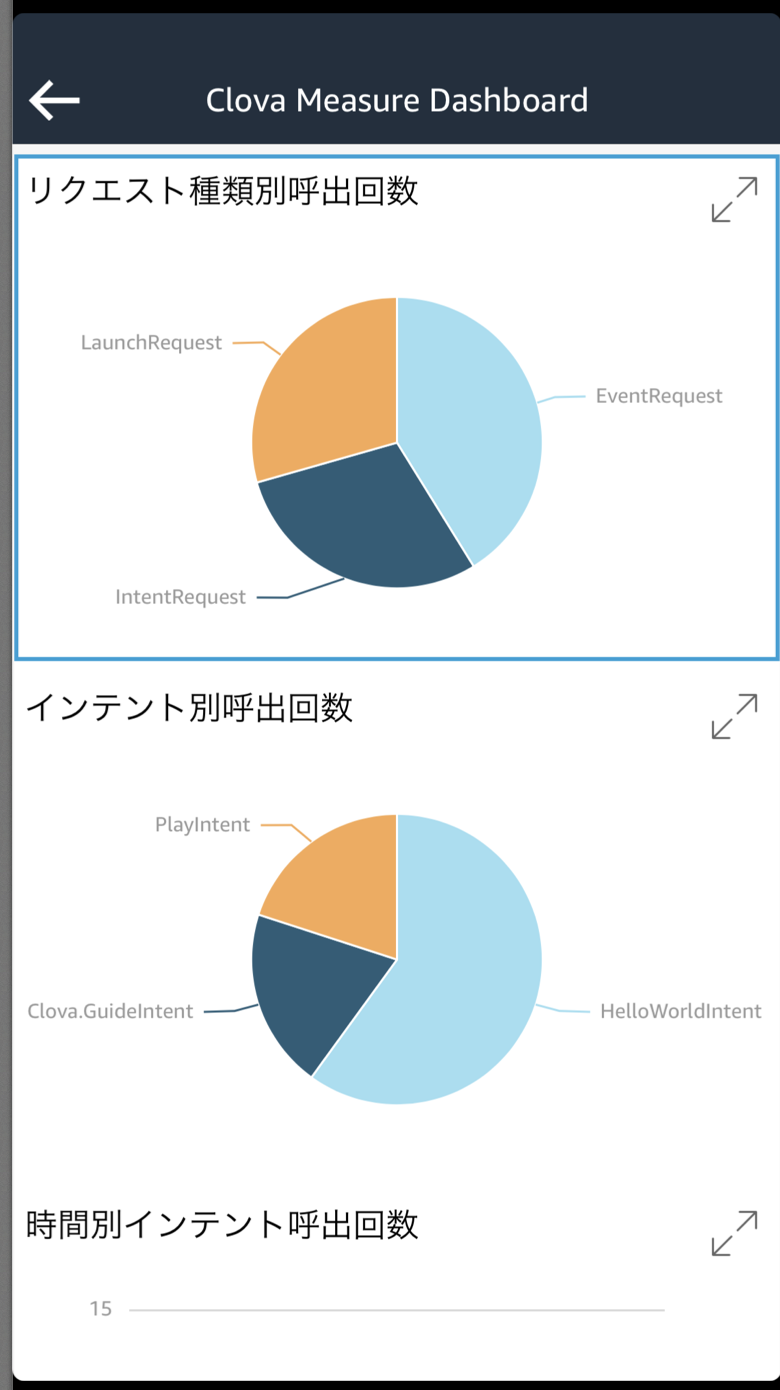
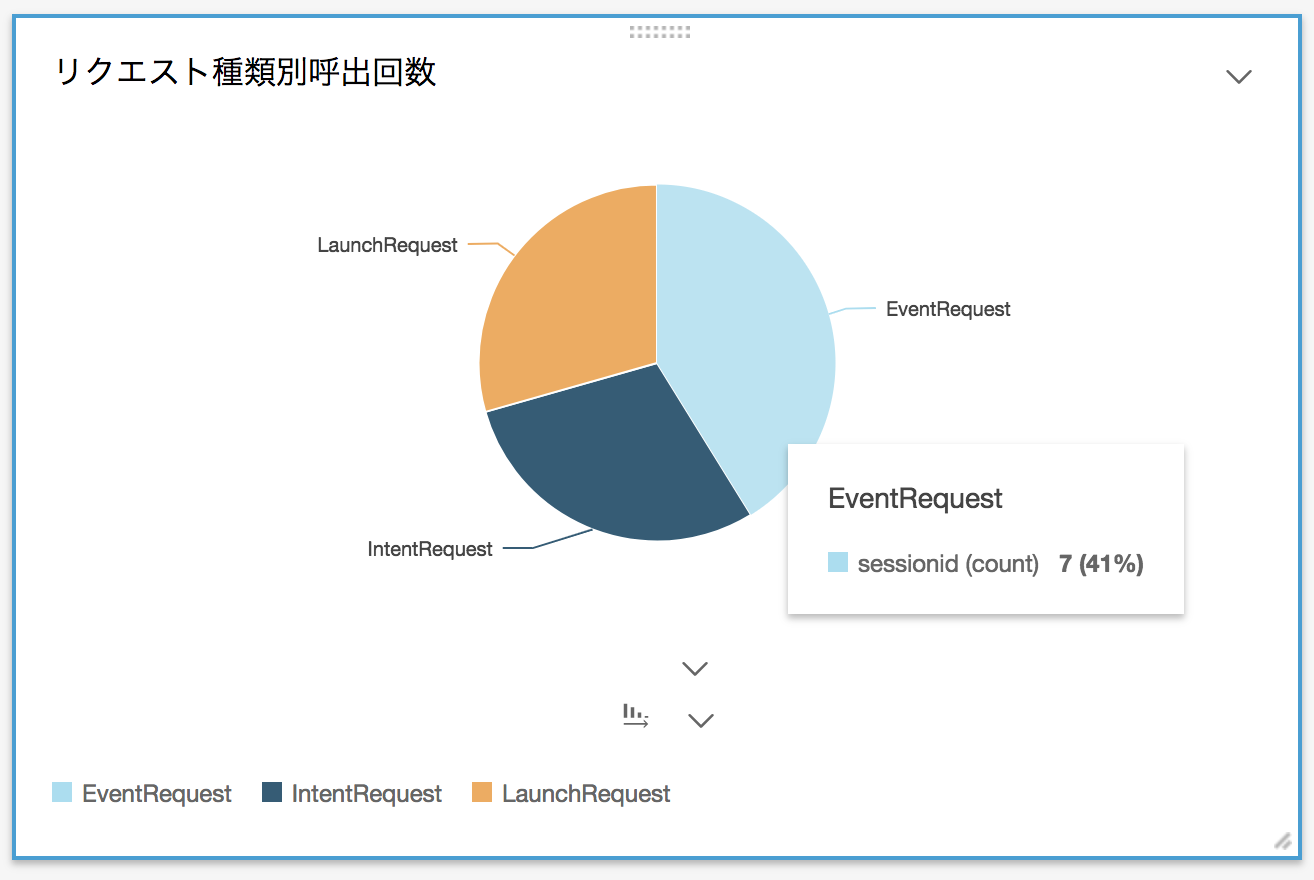
ここでは、リクエスト種類(LaunchRequest, IntentRequest, EventRequest)毎の呼出回数を円グラフで表示します。
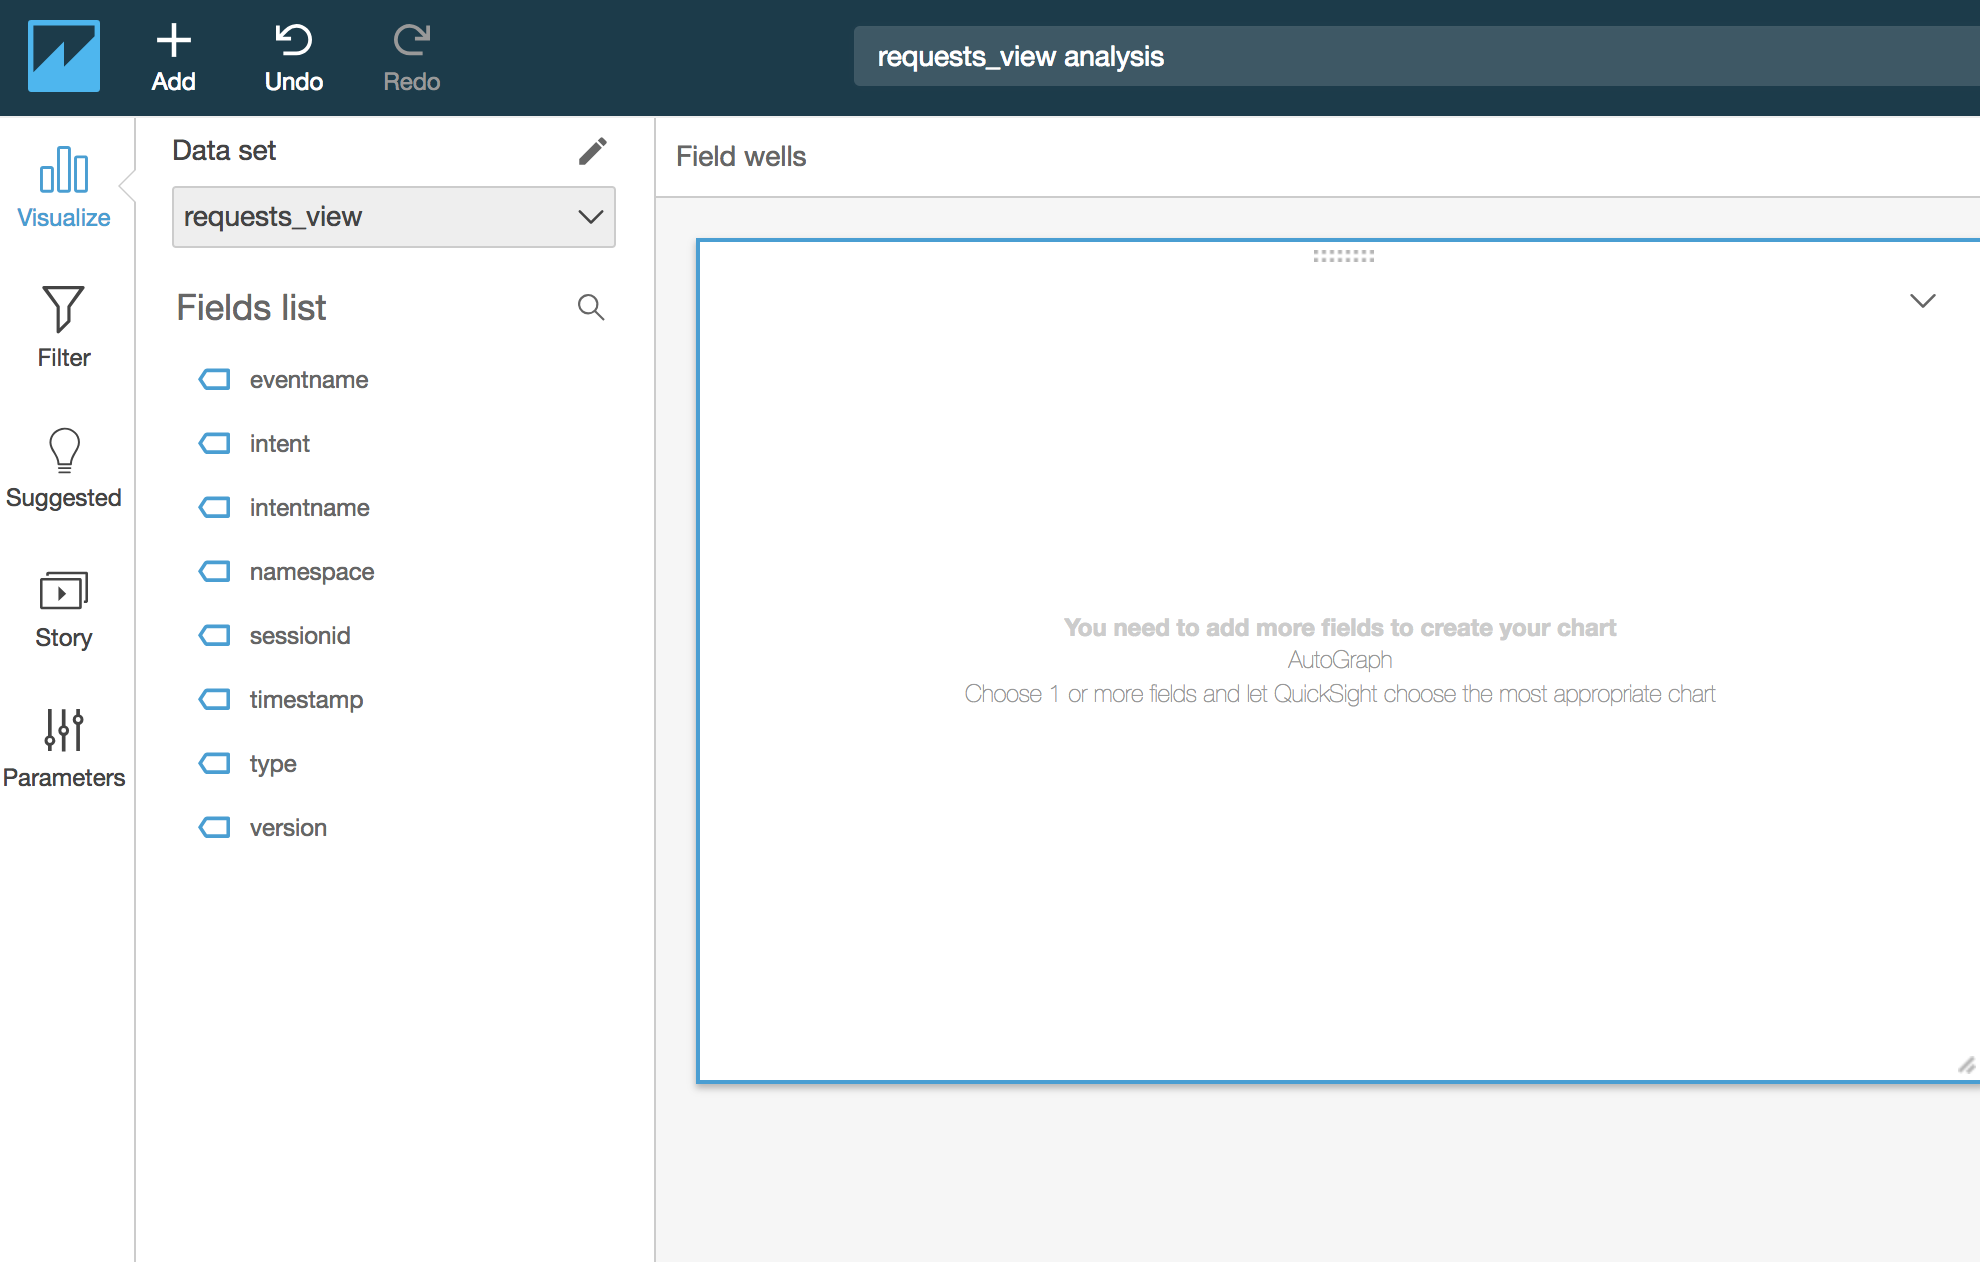
Visual 作成
- Visual typesで、
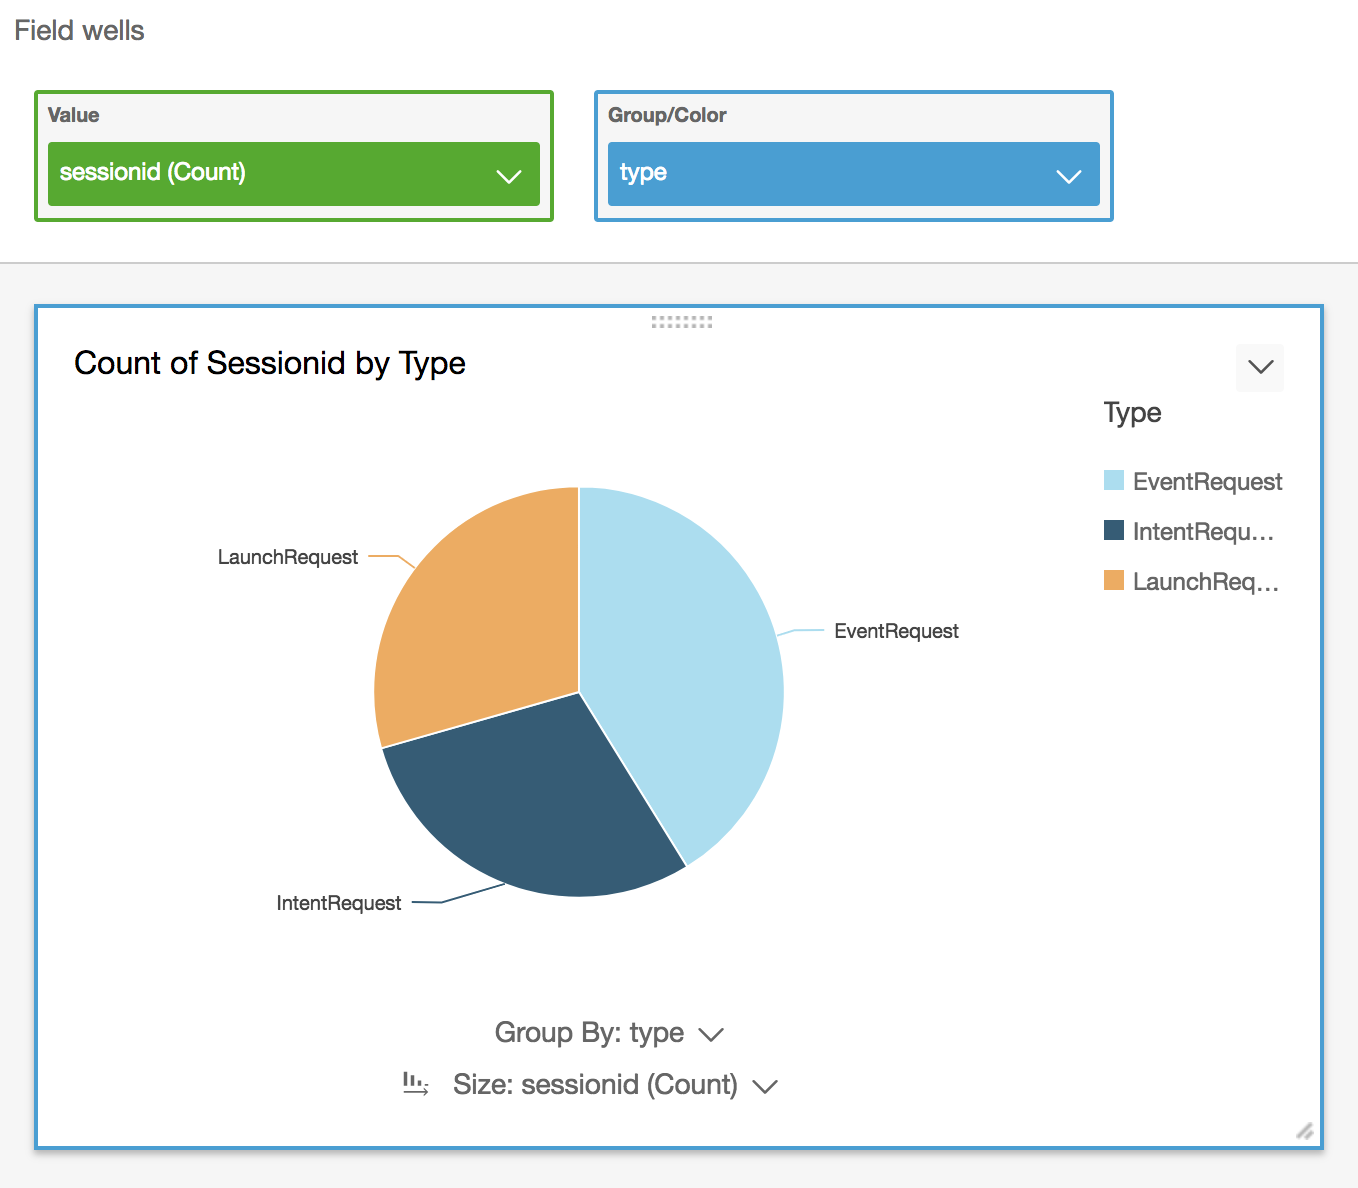
Pie Chartを選択 - Field wellsに以下の値を設定
| 項目 | 設定値 |
|---|---|
| Value | sessionId |
| Group/Color | type |
設定が終わると以下のように表示されたでしょうか?
少し見た目を変更します。
- 右上のメニューから、
Format visualを選択します。
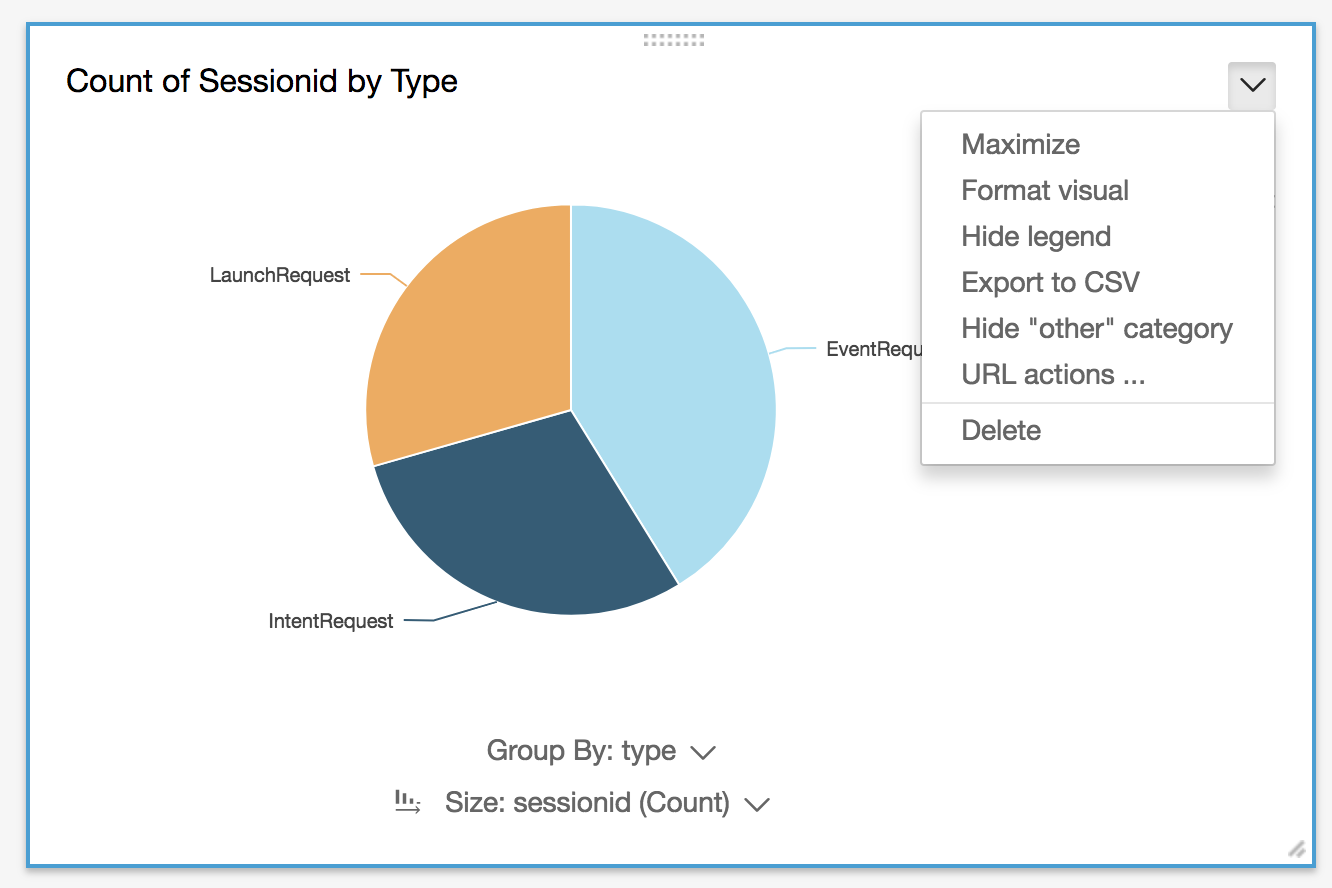
画面左側にメニューが表示されるので、好みに合わせて変更します。
ここでは、凡例表示位置を下に移動・タイトルを変更しています。
まとめ
本投稿では、ClovaのユーザリクエストをQuickSightを利用して可視化を試しました。
サーバレスで手軽に色々試せるのは楽しいですね!
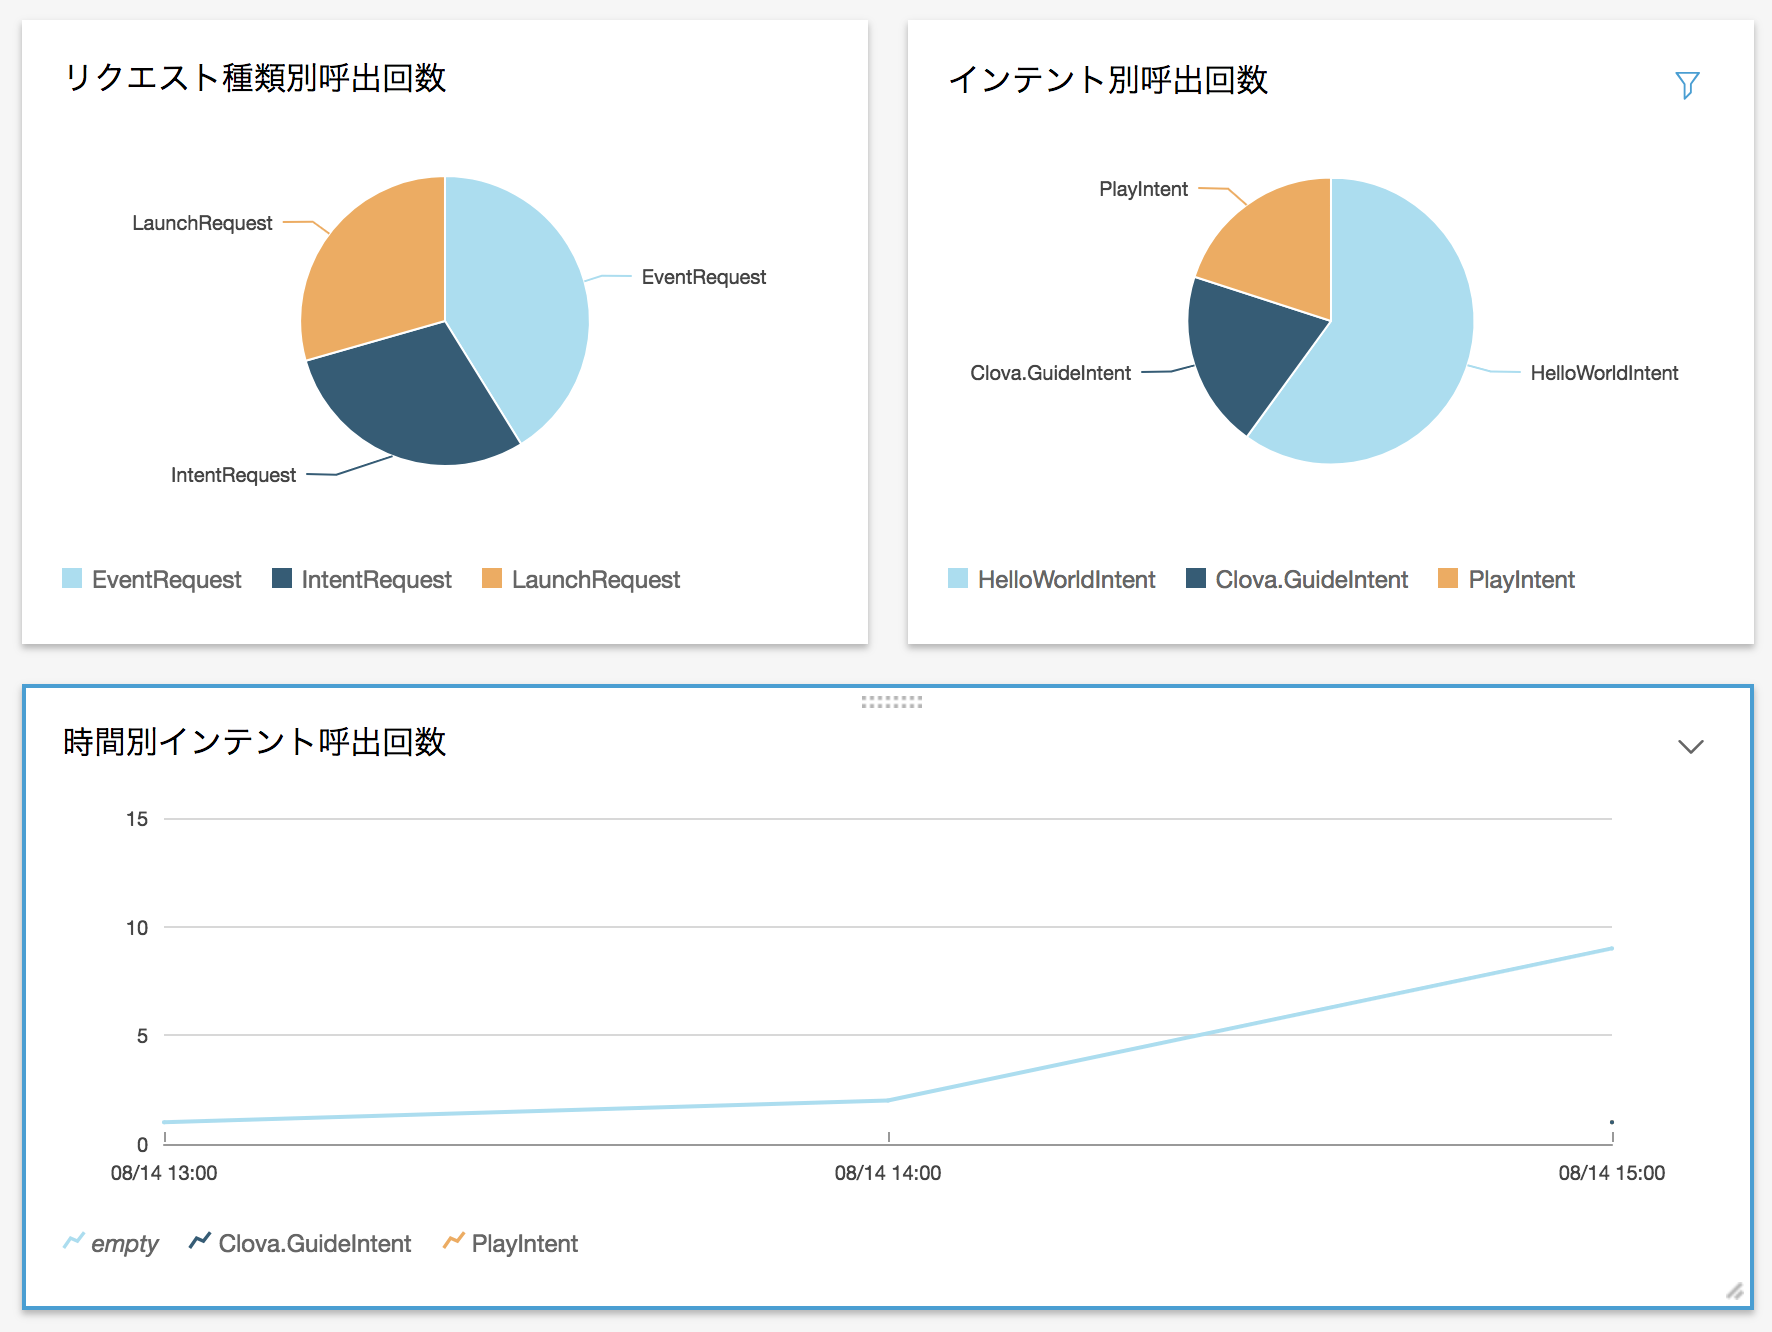
他にも以下のようなグラフも作成できます!
折れ線グラフはサンプルデータがおかしいですが。。。
本投稿で作成したCustom Extensionのソースは近々公開します。
おまけ
QuickSightはiPhoneでも利用できます。
こんな感じです