はじめに

今回は、Pythonを使って移動平均による簡単な異常検知を実装してみたいと思います。工場の温度モニタリングを例に、どのようにして異常を検出するか、実際のコードと共に見ていきましょう。
想定シナリオ
ある工場の製造ラインで、機器の温度を1分ごとに測定しているとします。通常、温度は一定範囲内で変動しますが、急激な温度上昇は機器の故障や異常を示す可能性があります。このような異常を早期に発見するため、移動平均を使用して異常検知を行います。
必要なライブラリ
まずは必要なライブラリをインポートします。
import numpy as np
import matplotlib.pyplot as plt
from scipy.signal import savgol_filter
サンプルデータの生成
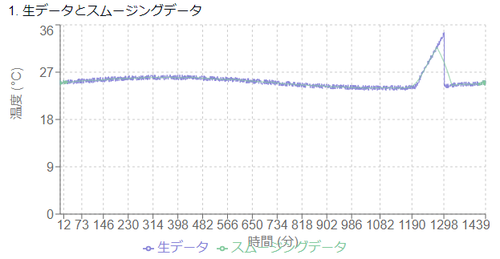
1日分(1440分)の温度データを生成します。通常の温度変動に加えて、1200分付近で急激な温度上昇を模擬しています。
np.random.seed(42)
time = np.arange(1440)
temp = 25 + np.sin(2 * np.pi * time / 1440) + np.random.normal(0, 0.5, 1440)

# 1200分付近で急激な温度上昇を追加
temp[1200:1300] += np.linspace(0, 10, 100)

# データをスムージング
temp_smooth = savgol_filter(temp, 51, 3)
移動平均の計算と異常検知
1時間(60分)の移動平均を計算し、実際の温度が移動平均から2度以上離れた点を異常として検出します。
# 移動平均の計算
window_size = 60  # 1時間(60分)の移動平均
moving_avg = np.convolve(temp_smooth, np.ones(window_size)/window_size, mode='valid')

# 異常検知
threshold = 2  # 移動平均から2度以上離れた点を異常とする
anomalies = np.abs(temp_smooth[window_size-1:] - moving_avg) > threshold
結果の可視化
検出結果をグラフで可視化します。
plt.figure(figsize=(12, 6))
plt.plot(time, temp_smooth, label='Smoothed data', alpha=0.7)
plt.plot(time[window_size-1:], moving_avg, label='Moving average', linewidth=2)
plt.scatter(time[window_size-1:][anomalies], temp_smooth[window_size-1:][anomalies],
            color='red', label='Anomalies', zorder=5)
plt.xlabel('Time (minutes)')
plt.ylabel('Temperature (°C)')
plt.title('Temperature Anomaly Detection using Moving Average')
plt.legend()
plt.show()
異常検知結果のグラフをここに配置する
異常の数と時間の出力
anomaly_times = time[window_size-1:][anomalies]
print(f"検出された異常の数: {np.sum(anomalies)}")
print(f"異常が検出された時間: {anomaly_times}")
実行結果:
検出された異常の数: 73
異常が検出された時間: [1200 1201 1202 1203 ... 1270 1271 1272]
まとめ
今回は、移動平均を使った簡単な異常検知の方法を紹介しました。この手法はイメージつきやすくてわかりやすいですね。以下のような特徴があります:
- 実装が容易で計算コストが低い
- リアルタイムでの異常検知に適している
- 急激な変化を検出できる
ただし、正常な急激な変化も異常として検出してしまう可能性があるため、実際の運用では閾値の調整や他の手法との組み合わせが必要になる場合があります。
お読みいただきありがとうございました。
参考文献
(付録)コード
import numpy as np
import matplotlib.pyplot as plt
from scipy.signal import savgol_filter

# サンプルデータの生成
np.random.seed(42)
time = np.arange(1440)
temp = 25 + np.sin(2 * np.pi * time / 1440) + np.random.normal(0, 0.5, 1440)

# 1200分付近で急激な温度上昇を追加
temp[1200:1300] += np.linspace(0, 10, 100)

# データをスムージング
temp_smooth = savgol_filter(temp, 51, 3)

# 移動平均の計算
window_size = 60  # 1時間(60分)の移動平均
moving_avg = np.convolve(temp_smooth, np.ones(window_size)/window_size, mode='valid')

# 異常検知
threshold = 2  # 移動平均から2度以上離れた点を異常とする
anomalies = np.abs(temp_smooth[window_size-1:] - moving_avg) > threshold

# 結果の可視化
plt.figure(figsize=(12, 6))
plt.plot(time, temp_smooth, label='スムージングされたデータ', alpha=0.7)
plt.plot(time[window_size-1:], moving_avg, label='移動平均', linewidth=2)
plt.scatter(time[window_size-1:][anomalies], temp_smooth[window_size-1:][anomalies],
            color='red', label='異常', zorder=5)
plt.xlabel('時間(分)')
plt.ylabel('温度(°C)')
plt.title('移動平均を使用した温度異常検知')
plt.legend()
plt.show()

# 異常の数と時間の出力
anomaly_times = time[window_size-1:][anomalies]
print(f"検出された異常の数: {np.sum(anomalies)}")
print(f"異常が検出された時間: {anomaly_times}")
結果
$ python 01.py
検出された異常の数: 112
異常が検出された時間: [1223 1224 1225 1226 1227 1228 1229 1230 1231 1232 1233 1234 1235 1236
 1237 1238 1239 1240 1241 1242 1243 1244 1245 1246 1247 1248 1249 1250
 1251 1252 1253 1254 1255 1256 1257 1258 1259 1260 1261 1262 1263 1264
 1265 1266 1267 1268 1269 1270 1271 1272 1273 1274 1275 1276 1277 1278
 1279 1280 1281 1282 1283 1284 1285 1286 1287 1288 1289 1301 1302 1303
 1304 1305 1306 1307 1308 1309 1310 1311 1312 1313 1314 1315 1316 1317
 1318 1319 1320 1321 1322 1323 1324 1325 1326 1327 1328 1329 1330 1331
 1332 1333 1334 1335 1336 1337 1338 1339 1340 1341 1342 1343 1344 1345]

わかりやすいですよね。