何がしたかったか
pd.DataFrameに含まれるカテゴリ変数の情報を、パッと可視化したかった。
確かに.describe()でだいたいわかる。でも目で見たかったんだ、、、
df.hist(というかplot関数は)カテゴリ変数を描画しない
df.hist??から抜粋
def hist_frame(data, column=None, by=None, ...):
    _converter._WARN = False
    if by is not None:
        axes = grouped_hist(data, column=column, by=by, ...)
        return axes

    if column is not None:
        if not isinstance(column, (list, np.ndarray, Index)):
            column = [column]
        data = data[column]
    data = data._get_numeric_data() # 数字だけ!!!
    naxes = len(data.columns)

    fig, axes = _subplots(naxes=naxes, ax=ax, squeeze=False,
                          sharex=sharex, sharey=sharey, figsize=figsize,
                          layout=layout)
    // Omitted
    return axes
data = data._get_numeric_data()!!!!!!
だがしかし
カラムを指定すると使えるっぽい。
Titanic.Embarked.hist??より抜粋
(Titanic.Embarkedがpdのカラムでカテゴリ変数になってる)
def hist_series(self, by=None, ax=None, grid=True, xlabelsize=None,
                xrot=None, ylabelsize=None, yrot=None, figsize=None,
                bins=10, **kwds):
    import matplotlib.pyplot as plt

    if by is None:
        if kwds.get('layout', None) is not None:
            raise ValueError("The 'layout' keyword is not supported when "
                             "'by' is None")
        # hack until the plotting interface is a bit more unified
        fig = kwds.pop('figure', plt.gcf() if plt.get_fignums() else
                       plt.figure(figsize=figsize))
        if (figsize is not None and tuple(figsize) !=
                tuple(fig.get_size_inches())):
            fig.set_size_inches(*figsize, forward=True)
        if ax is None:
            ax = fig.gca()
        elif ax.get_figure() != fig:
            raise AssertionError('passed axis not bound to passed figure')
        values = self.dropna().values

        ax.hist(values, bins=bins, **kwds)
        ax.grid(grid)
        axes = np.array([ax])

        _set_ticks_props(axes, xlabelsize=xlabelsize, xrot=xrot,
                         ylabelsize=ylabelsize, yrot=yrot)

    else:
        if 'figure' in kwds:
            raise ValueError("Cannot pass 'figure' when using the "
                             "'by' argument, since a new 'Figure' instance "
                             "will be created")
        axes = grouped_hist(self, by=by, ax=ax, grid=grid, figsize=figsize,
                            bins=bins, xlabelsize=xlabelsize, xrot=xrot,
                            ylabelsize=ylabelsize, yrot=yrot, **kwds)

    if hasattr(axes, 'ndim'):
        if axes.ndim == 1 and len(axes) == 1:
            return axes[0]
    return axes
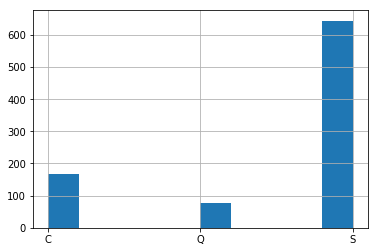
titanic.Embarked.hist()で、無事プロットできた。
以上。