はじめに
Pythonプログラムで即業務に役立つサンプルプログラムとして、地名/住所から緯度/経度を取得し地図にプロットするプログラムを作成しましたので、共有します。
動作環境
Visual Studio Code
Python3.9.1
各種インストールライブラリー
geocoder 1.38.1
geopy 2.2.0
googlemaps 4.6.0
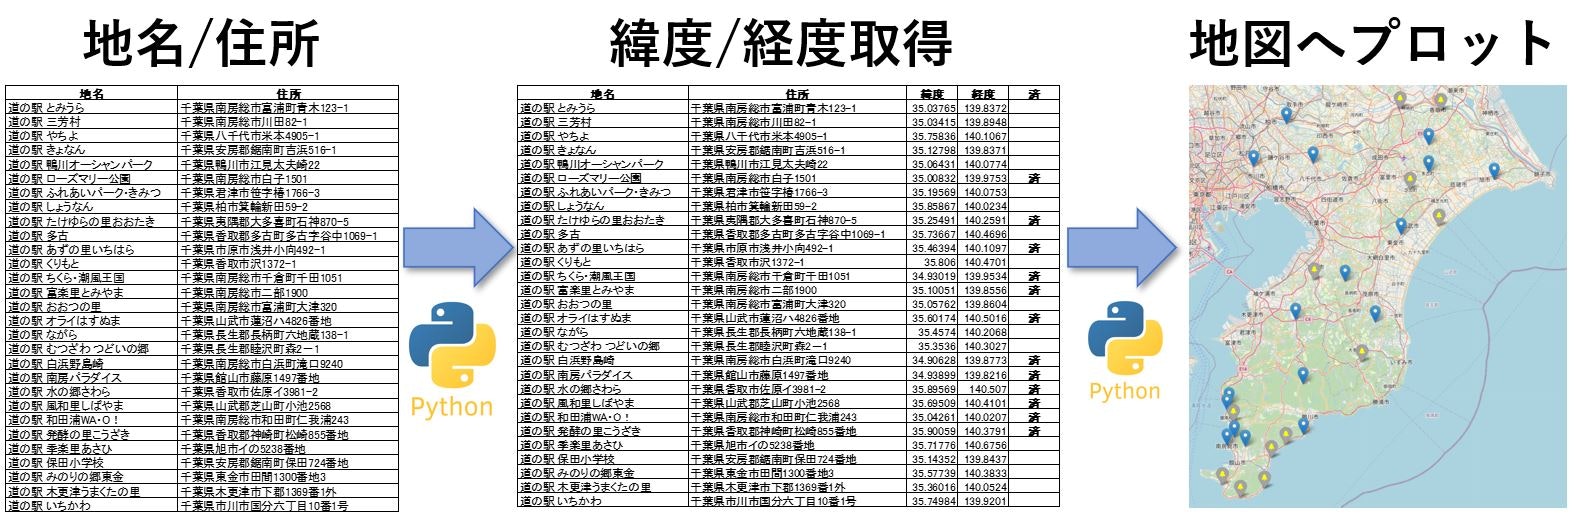
処理概要:
地名や住所一覧から、緯度、経度の情報を取得して、地図にプロットするプログラムです。
YouTubeでの解説:
プログラムの詳細やGoogleCloudPlatformでのAPIの取得方法などはYoutubeで詳しく解説していますので、ぜひ、ご覧ください。
サンプルソース
YouTubeで紹介している処理のプログラムソースです。
geocoder利用例:
Step1_1.py
import geocoder
location = '東京タワー'
ret = geocoder.osm(location, timeout=5.0)
print(ret.latlng)
print(ret.address)
geopy利用例:
Step1_2.py
from geopy.geocoders import Nominatim
geolocator = Nominatim(user_agent="user-id")
location = geolocator.geocode("東京タワー")
print(location.latitude, location.longitude)
print(location.address)
国土地理院のAPIを利用した例:
Step1_4.py
import requests
import urllib

makeUrl = "https://msearch.gsi.go.jp/address-search/AddressSearch?q="
s_quote = urllib.parse.quote('千葉県南房総市富浦町青木123-1')
response = requests.get(makeUrl + s_quote)
print(response.json()[0]["geometry"]["coordinates"])
Google Maps Platform APIを利用した例:
別途、Google Cloud Platformに登録してAPIキーの取得が必要です。
詳細手順はYouTube動画をご覧ください。:https://youtu.be/VPzNVUkUg4o
Step1_5.py
import googlemaps
gm = googlemaps.Client(key='APIキー')
res = gm.geocode('東京タワー')
print(res[0]['geometry']['location'])
print(res)
道の駅一覧に住所から一括で緯度/経度を変換する:
Step1_5.py
import googlemaps
import pandas as pd

df = pd.read_excel('道の駅一覧.xlsx')

gm = googlemaps.Client(key='APIキー')

for i, r in df.iterrows():
    res = gm.geocode(r['住所'])
    df.loc[i,'緯度'] = res[0]['geometry']['location']['lat']
    df.loc[i,'経度'] = res[0]['geometry']['location']['lng']
    print(i)
    print(res[0]['geometry']['location'])

df.to_excel('道の駅一覧.xlsx', index=None)
道の駅一覧から緯度/経度を元に一括で地図にプロットする:
Step2.py
import folium
import pandas as pd

df = pd.read_excel('道の駅一覧3.xlsx')

map = folium.Map(location=[df.loc[0,'緯度'],df.loc[0,'経度']], zoom_start=10)

for i, r in df.iterrows():
    if r['済']=='済':
        folium.Marker(location=[r['緯度'], r['経度']],
        icon=folium.Icon(icon="bell", icon_color='#ffff00', color="lightgray"),
        popup=r['地名']).add_to(map)

    else:
        folium.Marker(location=[r['緯度'], r['経度']], popup=r['地名']).add_to(map)

map.save("map.html")
最後に:
今後も、業務に役立ちそうなプログラムを作成して掲載していきたいと思います。