Rでできる基礎的プロットからちょっとだけ進歩。
複数のデータ(時系列データなど)を同じ図の中に描くことをやってみます。例によって、いきなりコードの紹介
まずは何も考えずmatplot
とりあえず、やってみます。
x <- 1:10
y1 <- 0.8*x
y2 <- 1.0*x
y3 <- 1.2*x

y4 <- matrix(0,10,4)

y4[ ,1] <- x
y4[ ,2] <- y1
y4[ ,3] <- y2
y4[ ,4] <- y3

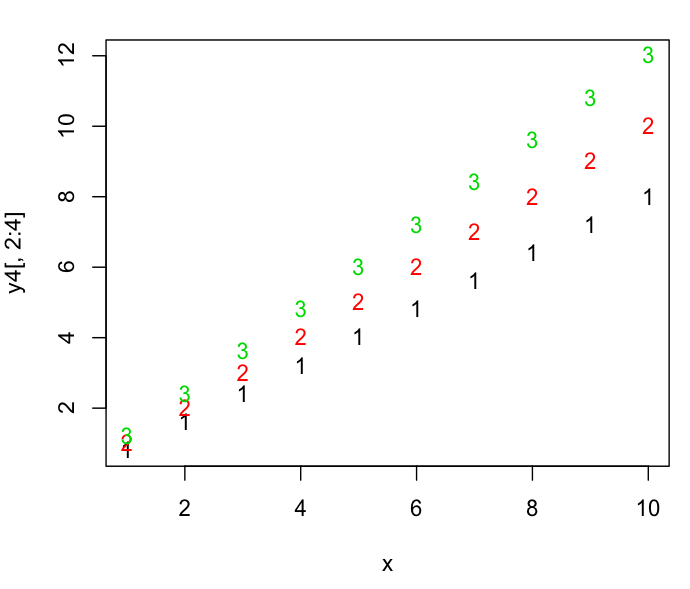
matplot(x,y4[ ,2:4])
このコードを、Rのコンソール画面にコピペしてエンターを押すと。以下の図が出ます。
・・・ダサいですね(笑)
Rって万能だと思いきや、いきなりダサいです。言うこと聞いてくれていません。
プログラミング言語は、その名の通り、相手との対話が必要なようです。では、イメージ通りに複数データを表現するには何が足りなかったのでしょう。。。
matplotを基本修正
とりあえず、以下のように変更してみます。
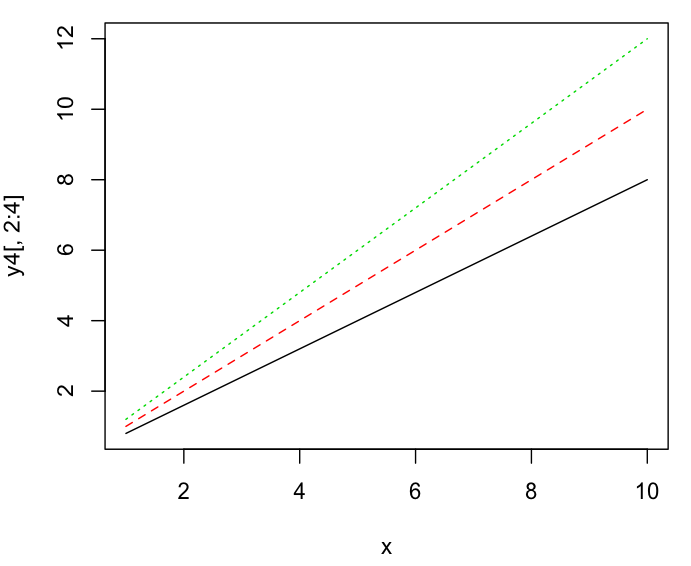
matplot(x,y4[ ,2:4],type=“l”)
すると。こうなります。
おー!なんかそれっぽいです。この調子です。
matplotでよく使うグラフィックパラメーター
そして、plot, matpoltなどで設定したい、基本的なグラフィックパラメーターは以下のものでしょうか。
# 複数のデータをプロット
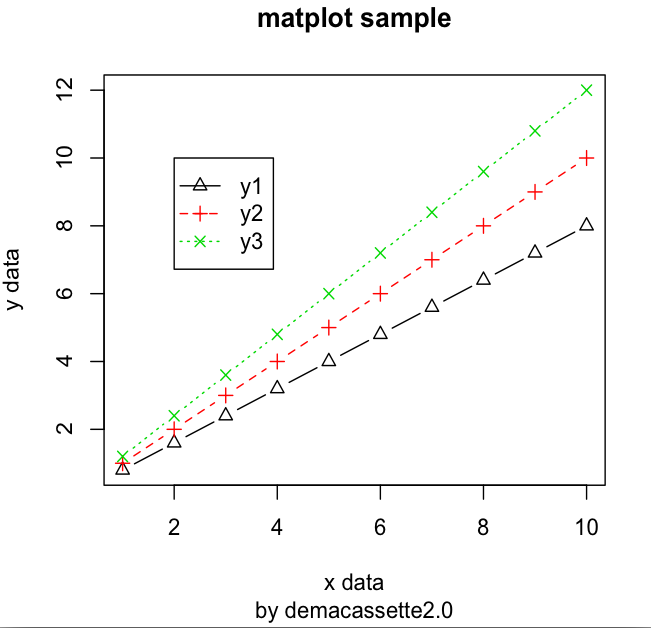
matplot(x,y4[,2:4],type="b",lwd=1.0,lty=1:3,pch=2:4,xlab=“xdata”,ylab=“ydata")

# 凡例を書く
legend(2,10,c("y1","y2","y3"), col=1:3,lty=1:3,pch=2:4)

# 表題を書く
title(main=“marplot sample”,sub=“by d-cassette”)
これを実行すると、以下になります。
とまぁ、この辺はググれば沢山情報はでてきますが、私が個人的によく使うコードを記録してみました。
その他の詳しい情報も含め、以下に記しています。
http://demacassette2.hateblo.jp/entry/2015/01/14/001031
では。


