titanicの生存者データを使ってみる。
# 参考サイト
# https://smart-hint.com/ml/tree/

import seaborn as sns
import pandas as pd
from sklearn.model_selection import train_test_split
from sklearn import tree
df = sns.load_dataset('titanic')
df.head()
 survived  pclass     sex   age  sibsp  parch     fare embarked  class  \
0         0       3    male  22.0      1      0   7.2500        S  Third
1         1       1  female  38.0      1      0  71.2833        C  First
2         1       3  female  26.0      0      0   7.9250        S  Third
3         1       1  female  35.0      1      0  53.1000        S  First
4         0       3    male  35.0      0      0   8.0500        S  Third

     who  adult_male deck  embark_town alive  alone
0    man        True  NaN  Southampton    no  False
1  woman       False    C    Cherbourg   yes  False
2  woman       False  NaN  Southampton   yes   True
3  woman       False    C  Southampton   yes  False
4    man        True  NaN  Southampton    no   True
df_x=df[["sex","pclass","fare"]]
df_y=df["survived"]
print(df_x,df_y)
 sex  pclass     fare
0      male       3   7.2500
1    female       1  71.2833
2    female       3   7.9250
3    female       1  53.1000
4      male       3   8.0500
..      ...     ...      ...
886    male       2  13.0000
887  female       1  30.0000
888  female       3  23.4500
889    male       1  30.0000
890    male       3   7.7500

[891 rows x 3 columns] 0      0
1      1
2      1
3      1
4      0
      ..
886    0
887    1
888    0
889    1
890    0
Name: survived, Length: 891, dtype: int64
sex, pclass, fareを切り出したdfをdf_x、survivedを切り出したものをdf_yとしておく。df_xが被説明変数、df_yが説明変数。次に、質的データである性別をダミー変数を用いて0,1に直す。
df_x=df[["sex","pclass","fare"]]
df_x=pd.get_dummies(df_x,drop_first=True)
print(df_x)
df_x=df[["sex","pclass","fare"]]
df_x=pd.get_dummies(df_x,drop_first=False)
print(df_x)
df_x=df[["sex","pclass","fare"]]
df_x=pd.get_dummies(df_x,drop_first=False)
print(df_x)
 pclass     fare  sex_male
0         3   7.2500         1
1         1  71.2833         0
2         3   7.9250         0
3         1  53.1000         0
4         3   8.0500         1
..      ...      ...       ...
886       2  13.0000         1
887       1  30.0000         0
888       3  23.4500         0
889       1  30.0000         1
890       3   7.7500         1

[891 rows x 3 columns]
     pclass     fare  sex_female  sex_male
0         3   7.2500           0         1
1         1  71.2833           1         0
2         3   7.9250           1         0
3         1  53.1000           1         0
4         3   8.0500           0         1
..      ...      ...         ...       ...
886       2  13.0000           0         1
887       1  30.0000           1         0
888       3  23.4500           1         0
889       1  30.0000           0         1
890       3   7.7500           0         1

[891 rows x 4 columns]
drop_first=Trueにすることでmale=0の列を削除できて、male=1とできる。
# train_test_splitを使って学習用途テスト用にデータを分割
# random_state=1で乱数を固定

from sklearn.model_selection import train_test_split
train_x,test_x, train_y, test_y=train_test_split(df_x,df_y,random_state=1)
from sklearn import tree
model=tree.DecisionTreeClassifier(max_depth=2,random_state=1)
#モデルの作成
print(type(model))

#fit メソッドで学習
model.fit(train_x, train_y)

#モデルをpredictで予測
print(model.predict(test_x))

# 正解率の計算
model.score(test_x,test_y)
<class 'sklearn.tree._classes.DecisionTreeClassifier'>
[1 0 1 0 1 0 0 1 0 0 0 0 0 0 0 0 0 0 0 1 0 0 1 0 0 0 1 1 0 1 0 0 0 0 0 0 0
 0 0 0 0 0 1 0 0 0 0 0 0 0 0 1 0 0 0 0 0 0 0 0 0 0 0 0 0 0 0 0 0 0 0 0 0 0
 1 0 1 0 0 1 0 0 0 0 1 0 0 0 0 1 0 0 0 0 0 0 0 0 0 0 0 0 0 0 1 0 0 0 0 0 0
 0 0 0 0 0 0 0 1 0 1 0 0 0 1 1 1 0 0 0 0 0 0 0 0 1 1 0 0 0 1 0 1 0 0 0 0 0
 0 0 0 0 0 0 0 0 0 0 1 0 0 0 0 0 0 0 1 0 0 0 1 0 1 0 1 0 0 0 0 0 1 1 0 0 1
 0 0 1 0 1 0 0 0 0 0 1 0 1 0 0 0 1 0 0 0 1 1 0 0 0 1 0 0 0 0 0 0 1 1 0 0 0
 0]

0.7533632286995515
決定木の可視化を行う。
from sklearn.tree import plot_tree
import matplotlib.pyplot as plt

plt.figure(figsize=(15, 10))
plot_tree(model, feature_names=train_x.columns,
          class_names=True,
          filled=True)
plt.savefig("tree.png", facecolor="azure", edgecolor="coral")
plt.show()
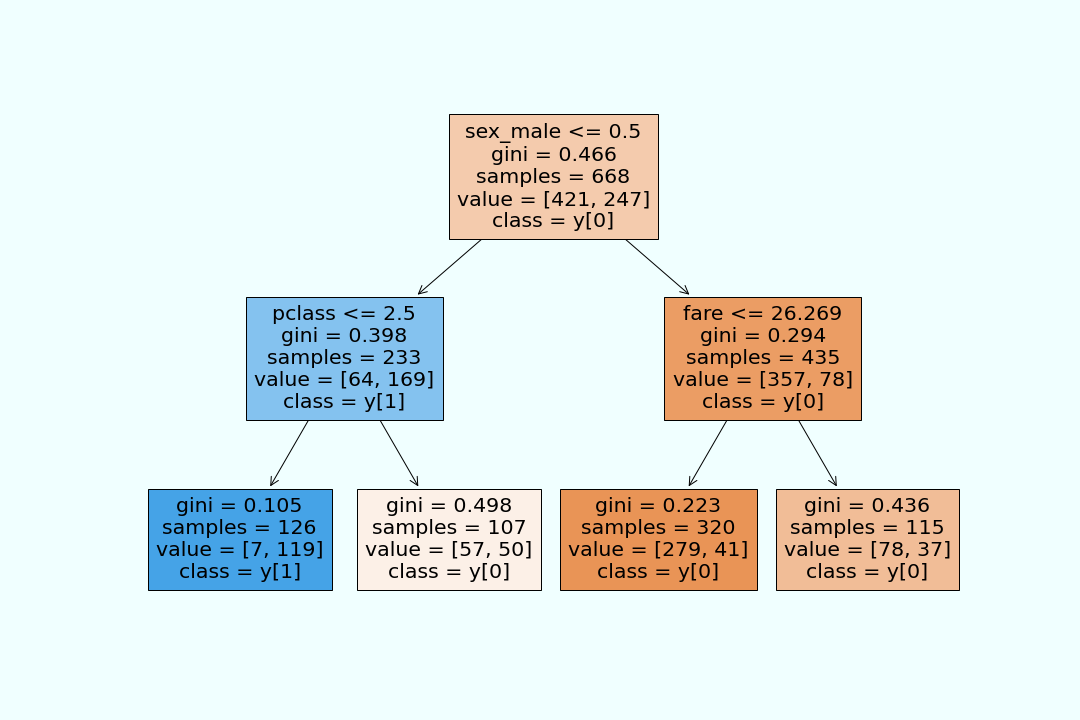
デフォルトだと背景色が透明なので色をつけた。
sexのラベルが(male,female)=(1,0)。giniはジニ係数のことで後で詳しく調べる。value=[421,247]は、421人がグループA、247人がグループBということ。
class_name=Trueで目的変数のクラス名もグラフに追加できる。(y[0]だと死亡に振り分ける)
参考