Istio enabled Kubernetesで高負荷テスト
KubernetesクラスターでIstioをインストールしてトラフィックをコントロールする用例が増えていると思います。Istioを使いこなせば、トラフィックシフティングによるカナリアリリースや、ミラーリングによるシャドウABテスト、サーキットブレーカーによる障害回避等々、便利なことが簡単に実現できます。
IstioはKubernetesのpodにistio sidecarというenvoyをインジェクトし、サイドカーコンテナとして稼働させることでpodへの通信を制御します。istio sidecarは追加可否をpodごとに設定できますが、istio sidecarを追加した場合は基本的にプロキシとして全ての通信を仲介します。
これは言い方を変えると、istio sidecarがパフォーマンスを出せない場合、通信上のボトルネックになりうるということです。
今回はIstioの有効化されたKubernetesクラスターで、istio sidecar有り無しによるネットワークパフォーマンスの差異と、istio sidecarがボトルネックになった場合の対処法を説明します。
Istio: https://istio.io/
vegeta attack: https://github.com/tsenart/vegeta
なぜ負荷テスト?
ちょっと仕事で(というか9割方以上趣味で)Istioの高アクセス負荷テストをやることになって、そのボトルネック調査をしたのがきっかけです。
負荷テストは楽しい。
今回は使ったコードはこちらです。
https://github.com/shibuiwilliam/istio-load-test
負荷テストの条件
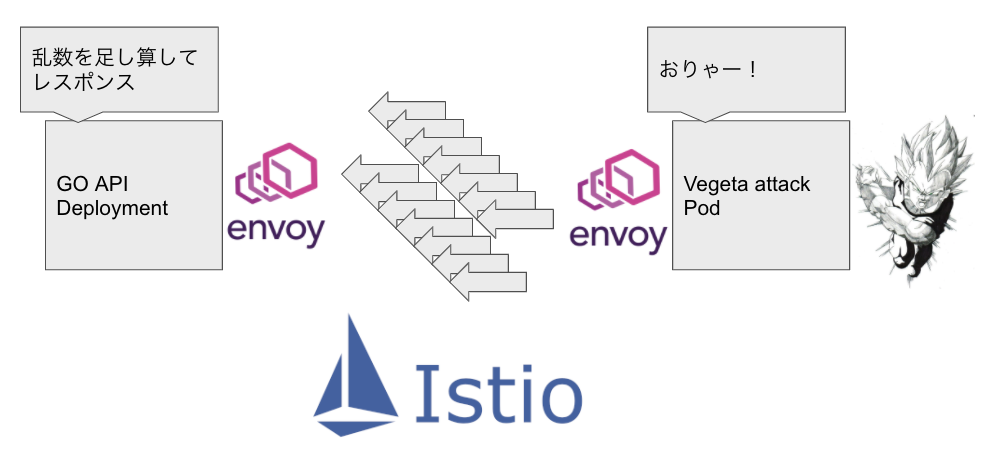
負荷テストはGolangで書いた簡単なHTTPサーバ(goapi)へのGETリクエストで実施します。
負荷テストクライアントにはvegeta attackというREST用負荷テストツールを使います。vegeta attackでは某サイヤ人の王子が得意とする連続エネルギー波のように、RESTリクエストを連続して送信します。
そのレイテンシーやタイムアウト、失敗を計測し、goapiの負荷耐性を検証します。
goapiは以下のとおり乱数を足し算して返すだけのとてもシンプルな内容です。Kubernetesクラスターで充分なリソースを設定していれば、10,000リクエスト/秒の高負荷環境でも、1リクエスト10ms以内で返せるはずの実装です。
package main

import (
	"flag"
	"fmt"
	"math/rand"
	"net/http"
	"strconv"
)

var (
	num int
)

func add() string {
	m := rand.Intn(num)
	n := rand.Intn(num)
	s := strconv.Itoa(m + n)
	fmt.Printf("%v\n", s)
	return s
}

func handler(w http.ResponseWriter, r *http.Request) {
	fmt.Fprintf(w, add())
}

func main() {
	flag.IntVar(&num, "num", 1000000, "num")
	flag.Parse()
	http.HandleFunc("/add", handler)
	http.ListenAndServe(":8080", nil)
}
負荷テストでは5分間、一律で10,000リクエスト/秒の負荷を与えます。タイムアウトは10msとします。
goapiはdeploymentで配備し、5podとします。リソースは一律、CPUリクエストは1000m、メモリリクエストは300Miとします。
vegeta attackは単一podで配備し、リソースはCPUリクエスト500m、メモリリクエスト300Miとします。
ただし、負荷テストの条件によってはそれぞれのリソースリクエストを調整します。
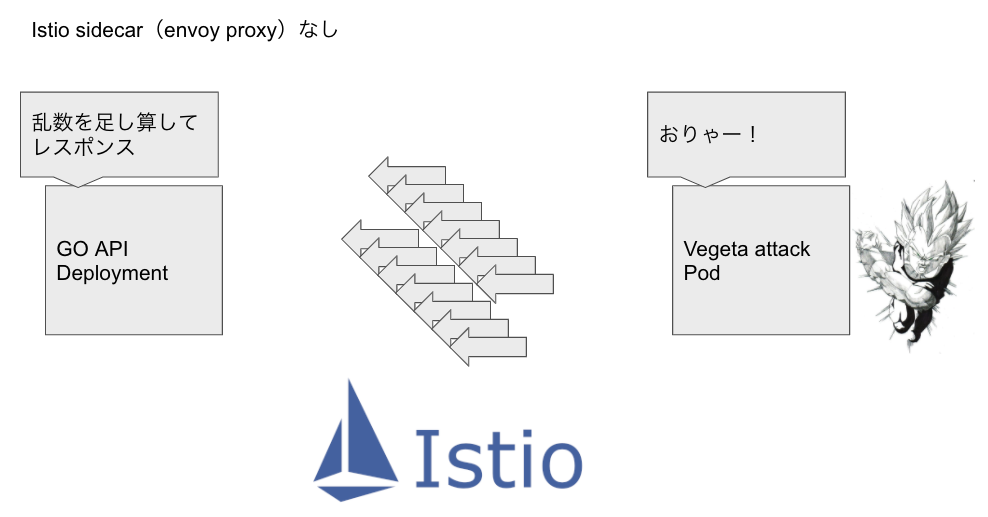
負荷テストクライアント、サーバ両方ともistio sidecarなし
比較対象としてistio sidecarなしで負荷テストです。
root@vegeta:/opt# vegeta attack -duration=300s -rate=10000 -timeout=10ms -targets=target | vegeta report -type='hist[0,2ms,4ms,6ms]'
Bucket         #        %       Histogram
[0s,    2ms]   2988892  99.63%  ##########################################################################
[2ms,   4ms]   9126     0.30%
[4ms,   6ms]   1170     0.04%
[6ms,   +Inf]  812      0.03%
良い感じに99.99%以上がタイムアウトせず、10ms以内にレスポンスされています。
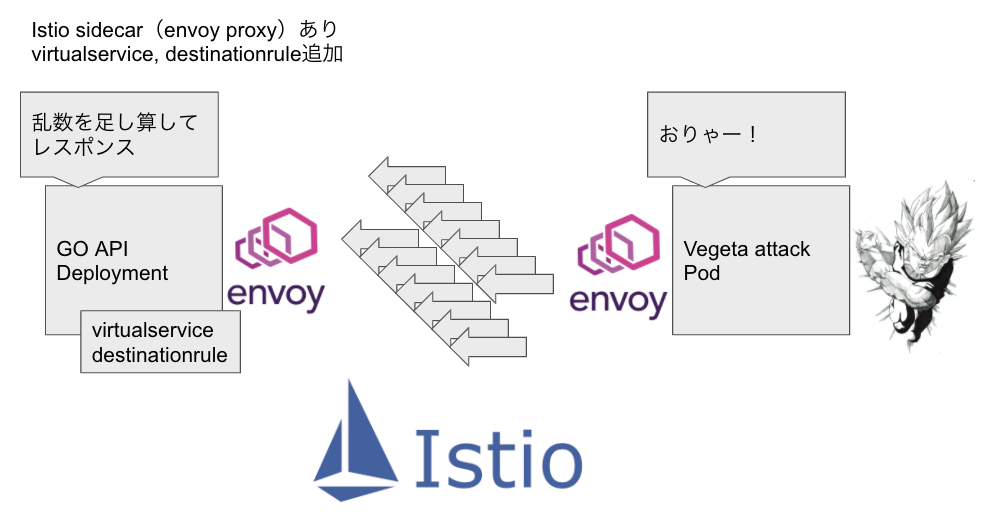
負荷テストクライアント、サーバ両方ともistio sidecarあり、サーバのみvirtualservice、destinationruleあり
再度比較対象として、負荷テストクライアント、サーバ両方にistio sidecarを追加しています。
サーバにはvirtualserviceとdestinationruleを入れています。
root@vegeta:/opt# vegeta attack -duration=300s -rate=10000 -timeout=10ms -targets=target | vegeta report -type='hist[0,2ms,4ms,6ms]'
Bucket         #        %        Histogram
[0s,    2ms]   0        0.00%
[2ms,   4ms]   10       0.00%
[4ms,   6ms]   28       0.00%
[6ms,   +Inf]  1344391  100.00%  ##########################################################################
見事にほとんどがタイムアウトしています。
どこにボトルネックがあるのでしょう・・・?
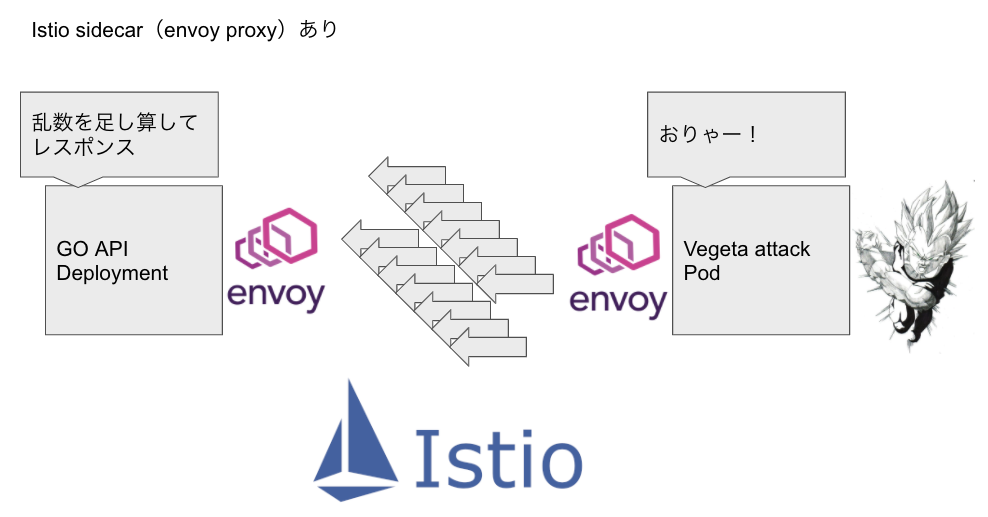
負荷テストクライアント、サーバ両方ともistio sidecarあり、virtualservice、destinationruleなし
ボトルネックを見つけるため、一つずつ機能を排除していきます。
まずはvirtualservice、destinationruleを排除します。
root@vegeta:/opt# vegeta attack -duration=300s -rate=10000 -timeout=10ms -targets=target | vegeta report -type='hist[0,2ms,4ms,6ms]'
Bucket         #        %       Histogram
[0s,    2ms]   4        0.00%
[2ms,   4ms]   67       0.00%
[4ms,   6ms]   130      0.01%
[6ms,   +Inf]  1353854  99.99%  ##########################################################################
またほとんどがタイムアウトです。
virtualservice、destinationruleが原因ではなさそうですね。
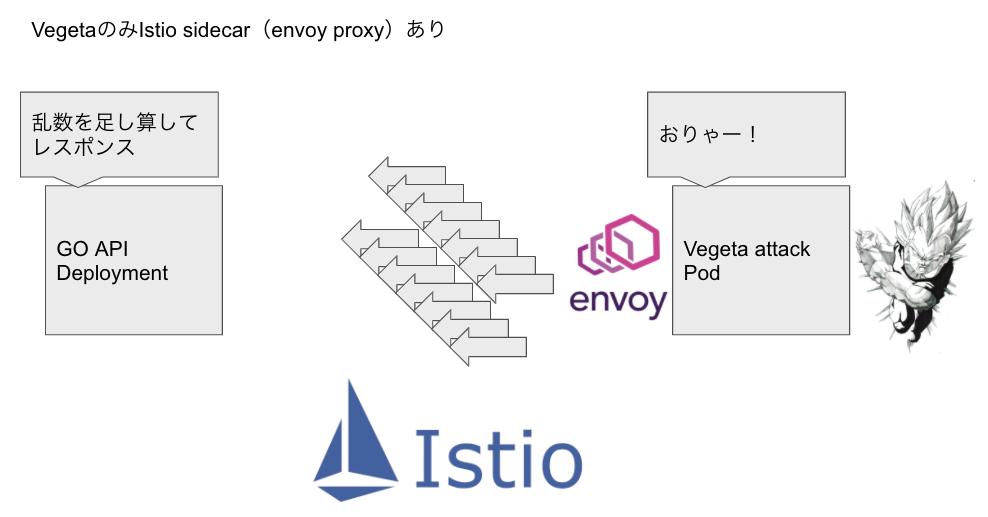
負荷テストクライアントのistio sidecarあり、サーバのistio sidecarなし
負荷テストではボトルネックはサーバだけでなく、負荷テストクライアント側に存在することもあります。
ボトルネックを突き止めるためには両者に機能を付け足しながら調査していくことになります。
今回は負荷テストクライアントのみistio sidecarを追加し、サーバからはistio sidecarを削除しました。
これで、最初のistio sidecarを使わない比較対象と比べて、負荷テストクライアントのみistio sidecarがくっついている状態になります。
root@vegeta:/opt# vegeta attack -duration=300s -rate=10000 -timeout=10ms -targets=target | vegeta report -type='hist[0,2ms,4ms,6ms]'
Bucket         #        %       Histogram
[0s,    2ms]   7        0.00%
[2ms,   4ms]   31       0.00%
[4ms,   6ms]   39       0.00%
[6ms,   +Inf]  1359632  99.99%  ##########################################################################
結果、またほとんどがタイムアウトでした。
これで負荷テストクライアントのistio sidecarが遅い要因と言えるかと思います。
負荷テストクライアントのistio sidecarが確実にボトルネックと言えることを確認するため、負荷テストクライアントからistio sidecarを外し、逆にサーバにistio sidecarを追加します。
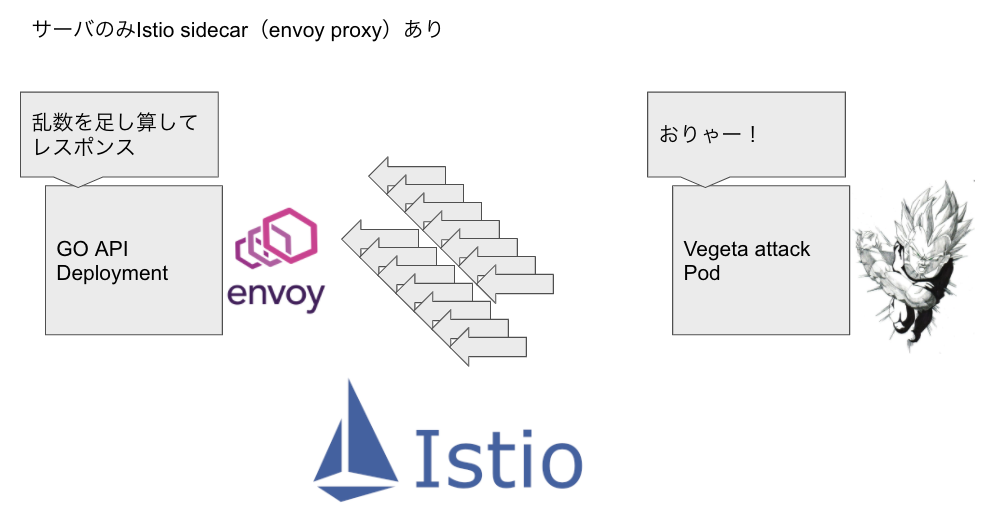
負荷テストクライアントのistio sidecarなし、サーバのistio sidecarあり、virtualservice、destinationruleなし
サーバのみistio sidecarが追加された構成です。
root@vegeta:/opt# vegeta attack -duration=300s -rate=10000 -timeout=10ms -targets=target | vegeta report -type='hist[0,2ms,4ms,6ms]'

Bucket         #        %       Histogram
[0s,    2ms]   2964541  98.82%  ##########################################################################
[2ms,   4ms]   31232    1.04%
[4ms,   6ms]   2266     0.08%
[6ms,   +Inf]  1961     0.07%
99.9%以上が成功し、ほとんどタイムアウトしていません。
やはり負荷テストクライアントのistio sidecarがボトルネックになっているようです。
ボトルネックは排除して、Istioを使わないと判断すれば負荷テストは終了ですが、そうすると便利なトラフィックマネジメントが使えなくなります。
どうにかしてistio sidecarのパフォーマンスを上げて、Istioライフを満喫したいです。
そこで、istio sidecarのリソースをチューニングします。
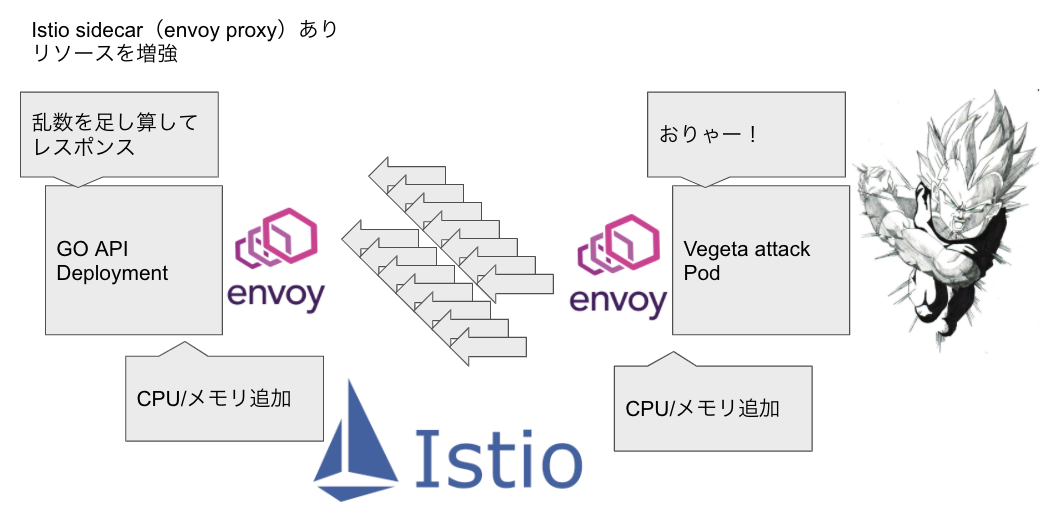
負荷テストクライアントのistio sidecarあり、サーバのistio sidecarあり。コンテナ、サイドカーのCPUを増強
Istio sidecarはKubernetes podのコンテナなので、CPU、メモリのリクエストを設定することができます。
Istio sidecarのリソースリクエストはpodのアノテーションで設定します。
apiVersion: v1
kind: Pod
metadata:
  name: vegeta
  namespace: go
  annotations:
    sidecar.istio.io/inject: "true"
    sidecar.istio.io/proxyCPU: "5000m"
    sidecar.istio.io/proxyMemory: "1Gi"
spec:
  containers:
    - name: vegeta
      image: shibui/istio-load-test:vegeta_0.0.0
      imagePullPolicy: Always
      command:
        - tail
        - -f
        - /dev/null
      resources:
        requests:
          cpu: 5000m
          memory: "1Gi"
アノテーションで設定可能なパラメータは他にも多々あります。以下をご参照ください。
https://istio.io/latest/docs/reference/config/annotations/
今回はひとまずCPU 5000m、メモリ 1Giを設定しました。充分であろうリソースを設定して、CPU、メモリがボトルネックの原因なのか判定します。
root@vegeta:/opt# vegeta attack -duration=300s -rate=10000 -timeout=10ms -targets=target | vegeta report -type='hist[0,2ms,4ms,6ms]'
Bucket         #        %        Histogram
[0s,    2ms]   0        0.00%
[2ms,   4ms]   12       0.00%
[4ms,   6ms]   28       0.00%
[6ms,   +Inf]  1298137  100.00%  ##########################################################################
おっと、まだタイムアウトします。どうもリソースリクエストがボトルネックではないようです。
以下は負荷テスト中のクライアントのCPU、メモリの使用率です。どうもvegetaのCPU使用はオーバーコミット気味なのに、istio sidecarのCPUを有効に使い切っていないようです。
$ kubectl -n go top pod vegeta --containers
POD      NAME          CPU(cores)   MEMORY(bytes)
vegeta   vegeta        15407m       1078Mi
vegeta   istio-proxy   10m          90Mi
続いてサーバのCPU、メモリ使用率です。
POD                             NAME           CPU(cores)   MEMORY(bytes)
goapi-medium-766b4c66c6-8pzxc   goapi-medium   0m           5Mi
goapi-medium-766b4c66c6-8pzxc   istio-proxy    2m           51Mi
こちらも対して負荷がかかっているように見えません。リクエストが飛んできていないのでしょうか?
リソースをもっと有効活用できれば、もしかしたらもっとパフォーマンスが出るかもしれません。
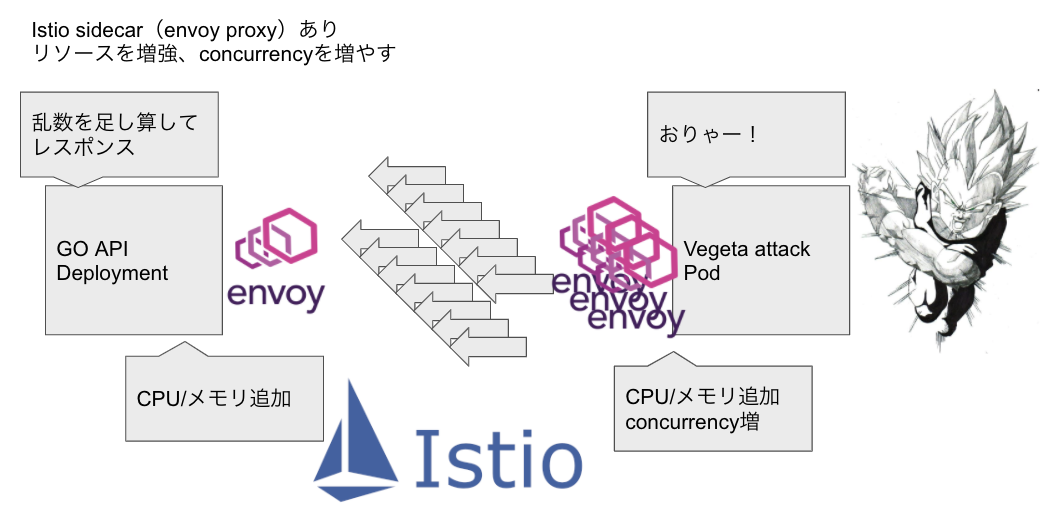
負荷テストクライアントのistio sidecarあり、サーバのistio sidecarあり。コンテナ、サイドカーのCPUを増強、サイドカーのconcurrencyを増やす
Istio sidecarにはconcurrencyというパラメータがあります。これは文字通り並列処理数で、ワーカースレッド数になるようです。
https://istio.io/latest/docs/reference/config/istio.mesh.v1alpha1/#ProxyConfig
この値を調整してみましょう。podではconcurrencyをproxy.istio.io/config: "{'concurrency':'16'}" というアノテーションで設定することができます。
apiVersion: v1
kind: Pod
metadata:
  name: vegeta
  namespace: go
  annotations:
    sidecar.istio.io/inject: "true"
    sidecar.istio.io/proxyCPU: "5000m"
    sidecar.istio.io/proxyMemory: "1Gi"
    proxy.istio.io/config: "{'concurrency':'16'}"
spec:
  containers:
    - name: vegeta
      image: shibui/istio-load-test:vegeta_0.0.0
      imagePullPolicy: Always
      command:
        - tail
        - -f
        - /dev/null
      resources:
        requests:
          cpu: 5000m
          memory: "1Gi"
これで負荷テスト!
root@vegeta:/opt# vegeta attack -duration=300s -rate=10000 -timeout=10ms -targets=target | vegeta report -type='hist[0,2ms,4ms,6ms]'
Bucket         #        %       Histogram
[0s,    2ms]   2912284  97.08%  ########################################################################
[2ms,   4ms]   85348    2.84%   ##
[4ms,   6ms]   1501     0.05%
[6ms,   +Inf]  867      0.03%
やっとパフォーマンスが出ました。総じて99.96%程度のリクエストをタイムアウトせずにレスポンスできています。
めでたしめでたし。
まとめ
というわけで、Istioを使ったKubernetesクラスターで負荷テストをやった結果でした。
今回はサーバではなく負荷テストクライアント側にボトルネックがあって、その調査をしました。
楽しかったです。