はじめに (残念ポイント)
- PlotlyのSankey-diagramは2node間で最大3本までしかlinkを引けない仕様のよう。
labelを用いてlinkを関連付け・細分化するとあっさり3本くらいは行くため、
ともすれば気づかない間に非表示linkが出現する、とてもとても注意。 - nodeのデフォソートはlinkのvalueで (主に?) 決まっているようだ、
アルファベット順にはならない。
例示用データ
airqualityデータを適当に加工して、それっぽいデータをでっちあげる。
イメージは30人の顧客ランク × 2or3ヶ月。
横持ちの方がやりやすいので横持ちに変換しておく。
# 使用パッケージ読み込み
library(plotly); library(tidyverse)

# 例示用データ作成
d <- airquality %>%
  as.tibble() %>%
  filter(Day != 31, Month %in% c(5, 7, 9)) %>%
  mutate(Rank = as.integer(cut_interval(Wind, 3)),
         Month = paste0("m", Month)) %>%    # 横持ち変換で列名が`数字`となるのを回避
  select(ID = Day, Month, Rank) %>%
  spread(Month, Rank)                       #  横持ちに変換
こんなデータです
| ID | m5 | m7 | m9 |
|---|---|---|---|
| 1 | 1 | 1 | 1 |
| 2 | 1 | 2 | 1 |
| 3 | 2 | 2 | 1 |
| 4 | 2 | 2 | 1 |
| 5 | 2 | 1 | 1 |
| 6 | 3 | 2 | 3 |
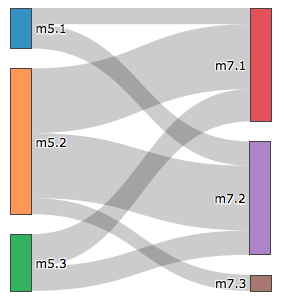
単純な例 (x 2ヶ月)
最低限必要なものは4つ。
- node label (重複は許されない)
- link source (node labelのindexで指定、外部用なので0から始まる点に注意)
- link target (node labelのindexで指定、外部用なので0から始まる点に注意)
- link value
## とりあえず数えあげたのち、列名を要素にpasteして列間での要素名の重複を排除。

d1 <- d %>%
  count(m5, m7) %>%
  mutate(m5 = paste("m5", m5, sep = "."),
         m7 = paste("m7", m7, sep = "."))


## node_labelは各列の要素を全部まとめてユニークをとる、sortはミス防止のため。

node_label <- d1 %>%
  select(m5, m7) %>%
  unlist() %>%
  unique() %>%
  sort()


## link sourceとlink targetはfactorの特性を用いてindexを算出するのが楽。
## 最後にマイナス1するのを忘れないように。

link_source_nodeind <- d1 %>%
  pull(m5) %>%
  factor(levels = node_label) %>%
  as.numeric() %>%
  - 1

link_target_nodeind <- d1 %>%
  pull(m7) %>%
  factor(levels = node_label) %>%
  as.numeric() %>%
  - 1


## link valueは数え上げた値をそのままつっこむ

link_value <- d1$n


## 作図する

p <- plot_ly(type = "sankey",
             domain = c(x =  c(0,1), y =  c(0,1)),
             orientation = "h",   # 縦方向 (h) or 横方向 (v)
             node = list(label = node_label),
             link = list(source =  link_source_nodeind,
                         target = link_target_nodeind,
                         value =  link_value))

p      # 出力後、nodeの並びをお好みで変更。
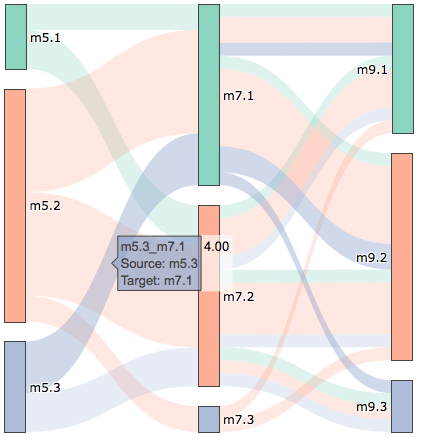
ちょっと複雑な例
x 3ヶ月のデータを対象に、link labelを用いて1-2ヶ月目とその下層の2-3ヶ月目を関連づける。
nodeとlinkにも色もつける (これが結構めんどい)。
関数化とか気にせず、一発こっきりなコードで記述。
なお、node数が多い場合にこのようなlinkのlabelによる関連付けを行うと、
あっという間に2node間の最大3本制限に引っかかるので注意。
## お好みで色ベクトルを作っておく
base_palette <- RColorBrewer::brewer.pal(8, "Set2")

## 色指定で楽をするために、回りくどいことをしている。
## 平たく言えば、factorのレベルを揃えている

d2.0 <- d %>%
  select(m5, m7, m9) %>%
  map_dfr(as.factor) %>%  # とりあえずfactor化
  fct_unify() %>%         # 全列のlevelsを統合
  bind_cols() %>%         # 上の処理でvector in list化されるので、tibbleに戻す
  imap_dfr(~ factor(.x,         # 各列間で要素名が重複しないよう、labelsを加工。
                    levels = levels(.x),
                    labels = paste(.y, levels(.x), sep = "."))) %>%
  count(m5, m7, m9) %>%
  mutate(link_label = paste(m5, m7, sep = "_"),     # m5とm7のセットで関連付けたいので、pasteしてlabel作成
         link_col = base_palette[as.numeric(m5)])   # linkの色はm5に揃える


## m5-m7間用データ
## m9気にせずまとめる

d2.1 <- d2.0 %>%
  group_by(m5, m7, link_label, link_col) %>%
  summarize(n = sum(n)) %>%
  ungroup() %>%
  rename(source = m5,
         target = m7)


## m7-m9間用データ

d2.2 <- d2.0 %>%
  rename(source = m7,
         target = m9) %>%
  select(-m5)

d2 <- bind_rows(d2.1, d2.2)   # fct型がchr変換されるが気にしなくてOK


node_label <- d2.0 %>%
  select(m5, m7, m9) %>%
  map(levels) %>%
  unlist()

node_color <- 1:(length(node_label)/3) %>%  # 各列のレベルは揃えてあるので、簡単
  rep(3) %>%
  base_palette[.] %>%
  alpha(0.7)


link_source_nodeind <- d2 %>%
  pull(source) %>%
  factor(levels = node_label) %>%
  as.numeric() %>%
  - 1

link_target_nodeind <- d2 %>%
  pull(target) %>%
  factor(levels = node_label) %>%
  as.numeric() %>%
  - 1

link_value <- d2$n

link_color <- d2$link_col %>%
  alpha(0.2)

link_label <- d2$link_label

p <- plot_ly(type = "sankey",
             domain = c(x =  c(0,1), y =  c(0,1)),
             orientation = "h",
             node = list(label = node_label,
                         color = node_color),
             link = list(source =  link_source_nodeind,
                         target = link_target_nodeind,
                         value =  link_value,
                         color = link_color,
                         label = link_label))

p     # あとはnodeの並びをマウスでいじいじしてFINISH。