PRML第9章ではEMアルゴリズムが紹介されています。EMアルゴリズム自体は様々なところで使える手法で、私自身はEMアルゴリズムとある分類器を組み合わせてよりノイズに頑健なクラス分類を行ったりしたことがあります。しかし、EMアルゴリズムを適用する応用例として一番有名な混合ガウス分布によるクラスタリングをしたことがなかったので、今回はEMアルゴリズムによる混合ガウス分布の最尤推定を実装しました。
混合ガウス分布の最尤推定
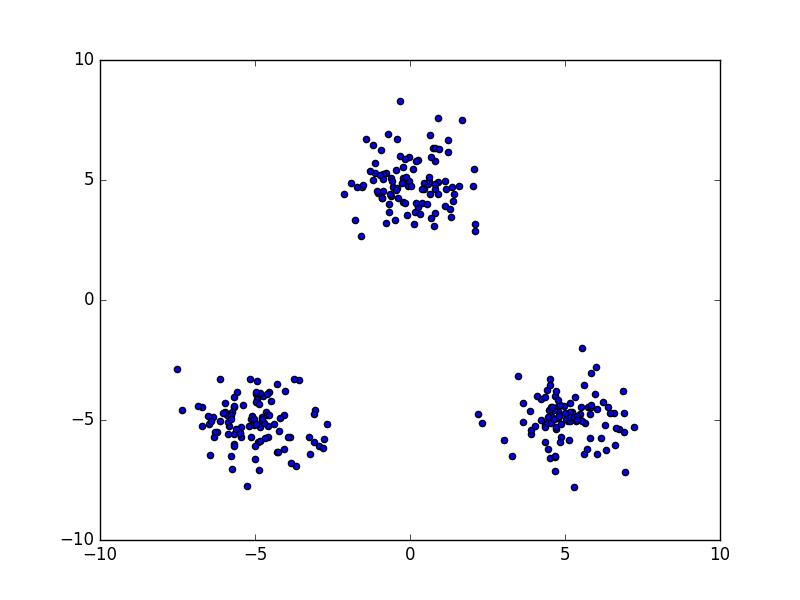
例えば、上の図の青点のようなデータ点を普通のガウス分布
p({\bf x}) = \mathcal{N}({\bf x}|{\bf\mu},{\bf\Sigma})
でフィッティングすると、
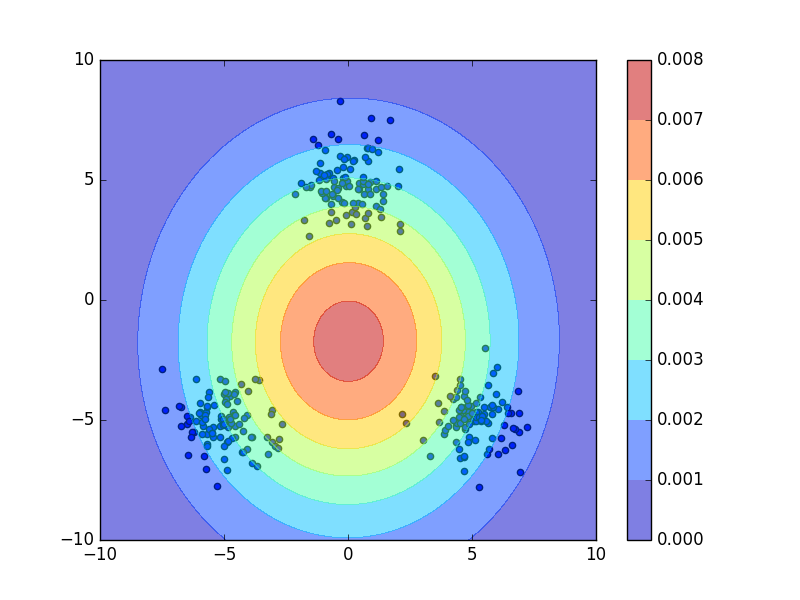
このようになってしまい、このケースでは単峰のガウス分布は適切なモデルではありません。データ点が3つの群に分かれていることに着目すると、今回の場合は3つのガウス分布を用いた混合ガウス分布
p({\bf x}) = \sum_{k=1}^3 \pi_k\mathcal{N}({\bf x}|{\bf\mu}_k,{\bf\Sigma}_k)
が適切なモデルであると考えられます。ただし、$\sum_k\pi_k=1$とします。それぞれ${\bf\mu}_1$が上、${\bf\mu}_2$が右下、${\bf\mu}_3$が左下のデータ点の塊の平均のようにします。よって塊ごとにガウス分布でフィッティングすればいいのですが、どのデータ点がどの塊に属するのかは私たち人間には一目瞭然ですが、機械にはそんなことは分かりません。
N個のデータ点の座標$\{{\bf x}_n\}_{n=1}^N$を観測変数として、どのデータ点がK個の塊のうちどれに属するかを1-of-k符号化で表す潜在変数$\{{\bf z}_n\}_{n=1}^N$とパラメータ$\{{\bf\pi}_k,{\bf\mu}_k,{\bf\Sigma}_k\}_{k=1}^K$を同時に推定します。このように潜在変数がある場合はEMアルゴリズムを用いるのが一般的です。
EMアルゴリズム
PRMLの第9.2.2項に混合ガウス分布をEMアルゴリズムで最尤推定する手順(PRML式(9.23)~(9.27))がまとめられているので割愛します。
コード
ライブラリ
いつもどおりにNumpyとmatplotlibを使います。
import matplotlib.pyplot as plt
import numpy as np
混合ガウス分布
class GaussianMixture(object):

    def __init__(self, n_component):
        # ガウス分布の個数
        self.n_component = n_component

    # EMアルゴリズムを用いた最尤推定
    def fit(self, X, iter_max=10):
        # データの次元
        self.ndim = np.size(X, 1)
        # 混合係数の初期化
        self.weights = np.ones(self.n_component) / self.n_component
        # 平均の初期化
        self.means = np.random.uniform(X.min(), X.max(), (self.ndim, self.n_component))
        # 共分散行列の初期化
        self.covs = np.repeat(10 * np.eye(self.ndim), self.n_component).reshape(self.ndim, self.ndim, self.n_component)

        # EステップとMステップを繰り返す
        for i in xrange(iter_max):
            params = np.hstack((self.weights.ravel(), self.means.ravel(), self.covs.ravel()))
            # Eステップ、負担率を計算
            resps = self.expectation(X)
            # Mステップ、パラメータを更新
            self.maximization(X, resps)
            # パラメータが収束したかを確認
            if np.allclose(params, np.hstack((self.weights.ravel(), self.means.ravel(), self.covs.ravel()))):
                break
        else:
            print("parameters may not have converged")

    # ガウス関数
    def gauss(self, X):
        precisions = np.linalg.inv(self.covs.T).T
        diffs = X[:, :, None] - self.means
        assert diffs.shape == (len(X), self.ndim, self.n_component)
        exponents = np.sum(np.einsum('nik,ijk->njk', diffs, precisions) * diffs, axis=1)
        assert exponents.shape == (len(X), self.n_component)
        return np.exp(-0.5 * exponents) / np.sqrt(np.linalg.det(self.covs.T).T * (2 * np.pi) ** self.ndim)

    # Eステップ
    def expectation(self, X):
        # PRML式(9.23)
        resps = self.weights * self.gauss(X)
        resps /= resps.sum(axis=-1, keepdims=True)
        return resps

    # Mステップ
    def maximization(self, X, resps):
        # PRML式(9.27)
        Nk = np.sum(resps, axis=0)

        # PRML式(9.26)
        self.weights = Nk / len(X)

        # PRML式(9.24)
        self.means = X.T.dot(resps) / Nk

        diffs = X[:, :, None] - self.means
        # PRML式(9.25)
        self.covs = np.einsum('nik,njk->ijk', diffs, diffs * np.expand_dims(resps, 1)) / Nk

    # 確率分布p(x)を計算
    def predict_proba(self, X):
        # PRML式(9.7)
        gauss = self.weights * self.gauss(X)
        return np.sum(gauss, axis=-1)

    # クラスタリング
    def classify(self, X):
        joint_prob = self.weights * self.gauss(X)
        return np.argmax(joint_prob, axis=1)
全体のコード
import matplotlib.pyplot as plt
import numpy as np


class GaussianMixture(object):

    def __init__(self, n_component):
        self.n_component = n_component

    def fit(self, X, iter_max=10):
        self.ndim = np.size(X, 1)
        self.weights = np.ones(self.n_component) / self.n_component
        self.means = np.random.uniform(X.min(), X.max(), (self.ndim, self.n_component))
        self.covs = np.repeat(10 * np.eye(self.ndim), self.n_component).reshape(self.ndim, self.ndim, self.n_component)
        for i in xrange(iter_max):
            params = np.hstack((self.weights.ravel(), self.means.ravel(), self.covs.ravel()))
            resps = self.expectation(X)
            self.maximization(X, resps)
            if np.allclose(params, np.hstack((self.weights.ravel(), self.means.ravel(), self.covs.ravel()))):
                break
        else:
            print("parameters may not have converged")

    def gauss(self, X):
        precisions = np.linalg.inv(self.covs.T).T
        diffs = X[:, :, None] - self.means
        assert diffs.shape == (len(X), self.ndim, self.n_component)
        exponents = np.sum(np.einsum('nik,ijk->njk', diffs, precisions) * diffs, axis=1)
        assert exponents.shape == (len(X), self.n_component)
        return np.exp(-0.5 * exponents) / np.sqrt(np.linalg.det(self.covs.T).T * (2 * np.pi) ** self.ndim)

    def expectation(self, X):
        resps = self.weights * self.gauss(X)
        resps /= resps.sum(axis=-1, keepdims=True)
        return resps

    def maximization(self, X, resps):
        Nk = np.sum(resps, axis=0)
        self.weights = Nk / len(X)
        self.means = X.T.dot(resps) / Nk
        diffs = X[:, :, None] - self.means
        self.covs = np.einsum('nik,njk->ijk', diffs, diffs * np.expand_dims(resps, 1)) / Nk

    def predict_proba(self, X):
        gauss = self.weights * self.gauss(X)
        return np.sum(gauss, axis=-1)

    def classify(self, X):
        joint_prob = self.weights * self.gauss(X)
        return np.argmax(joint_prob, axis=1)


def create_toy_data():
    x1 = np.random.normal(size=(100, 2))
    x1 += np.array([-5, -5])
    x2 = np.random.normal(size=(100, 2))
    x2 += np.array([5, -5])
    x3 = np.random.normal(size=(100, 2))
    x3 += np.array([0, 5])
    return np.vstack((x1, x2, x3))


def main():
    X = create_toy_data()

    model = GaussianMixture(3)
    model.fit(X, iter_max=100)
    labels = model.classify(X)

    x_test, y_test = np.meshgrid(np.linspace(-10, 10, 100), np.linspace(-10, 10, 100))
    X_test = np.array([x_test, y_test]).reshape(2, -1).transpose()
    probs = model.predict_proba(X_test)
    Probs = probs.reshape(100, 100)
    colors = ["red", "blue", "green"]
    plt.scatter(X[:, 0], X[:, 1], c=[colors[int(label)] for label in labels])
    plt.contour(x_test, y_test, Probs)
    plt.xlim(-10, 10)
    plt.ylim(-10, 10)
    plt.show()


if __name__ == '__main__':
    main()
結果
点を学習データとして混合ガウス分布のパラメータを最尤推定して、その確率分布を等高線で図示したものです。また、点の色はどのクラスタに属するかを表しています。
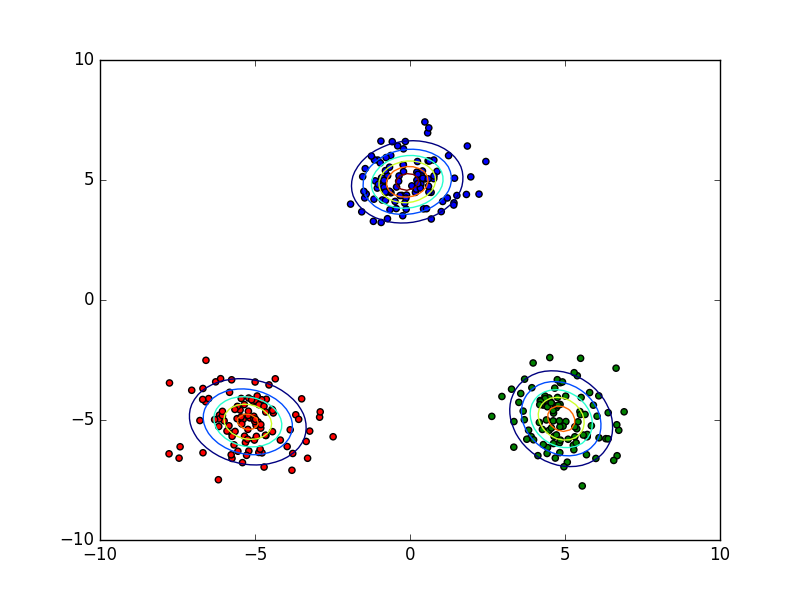
これは成功したときの結果ですが、たまに失敗します。PRMLにも記載されていますが、今回の対数尤度関数の最大化は不良設定問題になっていて良い解にならないことがあります。それを回避するヒューリスティックスもありますが、今回はその回避方法を実装していないのでたまに失敗します。といってもあまり失敗しないはずです。
終わりに
混合ガウス分布によるフィッティングを行うことで、教師なしのクラスタリングを行いました。その際に用いるガウス分布の個数をこちらで指定しました。次の第10章では適切な混合ガウス分布の要素数も自動的に推定する手法が紹介されているので、次回はそこで用いられている変分ベイズを実装します。