データ解析基礎論 a weekly assignment A07
WAA07.1
dat <- read.csv("http://peach.l.chiba-u.ac.jp/course_folder/waa07_1.csv")
plot(dat)
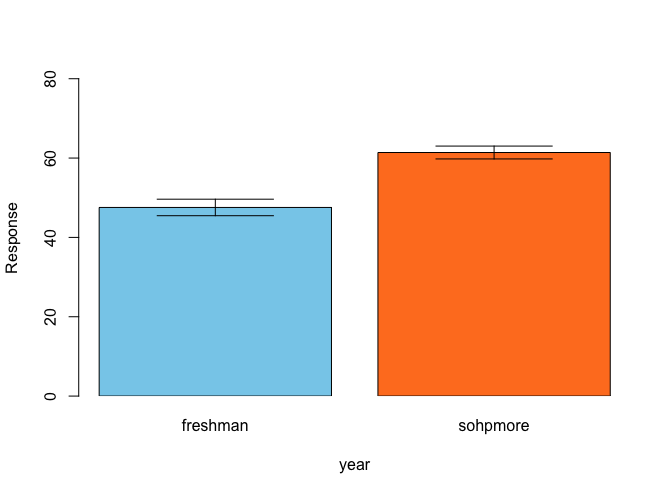
WAA06.1A: resp ~ grade
# plot
means <- tapply(dat$resp, dat$year, mean)
sds <- tapply(dat$resp, dat$year, sd)
ns <- tapply(dat$resp, dat$year, length)
sems = sds/sqrt(ns) #standard error (of the mean)
barplot2(means, plot.ci=T,
         ci.l = means - sems,
         ci.u = means + sems,
         ylim = c(0,80),
         names.arg = c("freshman","sohpmore"),
         col = c("skyblue","chocolate1"),
         xpd = F,
         ylab = "Response",
         xlab = "year")
# lm
A.lm <- lm(resp ~ year,dat)
summary(A.lm)
# 出力結果
Call:
lm(formula = resp ~ year, data = dat)

Residuals:
    Min      1Q  Median      3Q     Max
-35.550  -9.437  -0.475   9.488  21.450

Coefficients:
             Estimate Std. Error t value Pr(>|t|)
(Intercept)    47.550      1.865  25.494  < 2e-16 ***
yearsophmore   13.850      2.638   5.251 1.27e-06 ***
---
Signif. codes:  0 ‘***’ 0.001 ‘**’ 0.01 ‘*’ 0.05 ‘.’ 0.1 ‘ ’ 1

Residual standard error: 11.8 on 78 degrees of freedom
Multiple R-squared:  0.2612,	Adjusted R-squared:  0.2517
F-statistic: 27.57 on 1 and 78 DF,  p-value: 1.274e-06
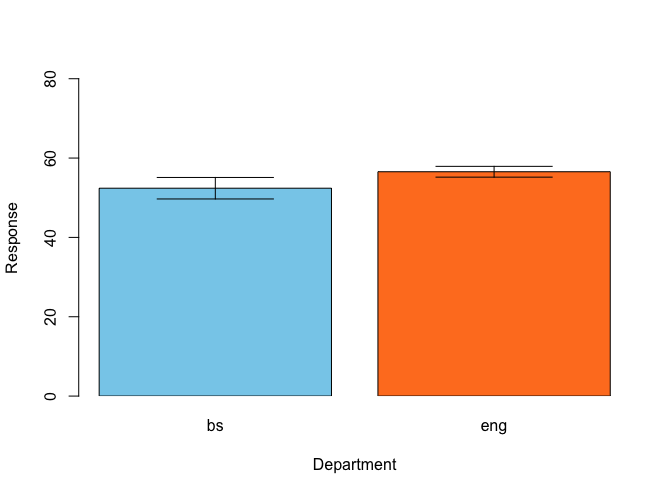
WAA06.1B: resp ~ dept
# plot
means <- tapply(dat$resp, dat$dept, mean)
sds <- tapply(dat$resp, dat$dept, sd)
ns <- tapply(dat$resp, dat$dept, length)
sems = sds/sqrt(ns) #standard error (of the mean)
barplot2(means, plot.ci=T,
         ci.l = means - sems,
         ci.u = means + sems,
         ylim = c(0,80),
         names.arg = c("bs","eng"),
         col = c("skyblue","chocolate1"),
         xpd = F,
         ylab = "Response",
         xlab = "Department")
# lm
B.lm <- lm(resp ~ dept,dat)
summary(B.lm)
# 出力結果
Call:
lm(formula = resp ~ dept, data = dat)

Residuals:
    Min      1Q  Median      3Q     Max
-40.400  -8.550  -1.475   9.812  29.600

Coefficients:
            Estimate Std. Error t value Pr(>|t|)
(Intercept)   52.400      2.144  24.437   <2e-16 ***
depteng        4.150      3.032   1.369    0.175
---
Signif. codes:  0 ‘***’ 0.001 ‘**’ 0.01 ‘*’ 0.05 ‘.’ 0.1 ‘ ’ 1

Residual standard error: 13.56 on 78 degrees of freedom
Multiple R-squared:  0.02345,	Adjusted R-squared:  0.01093
F-statistic: 1.873 on 1 and 78 DF,  p-value: 0.1751
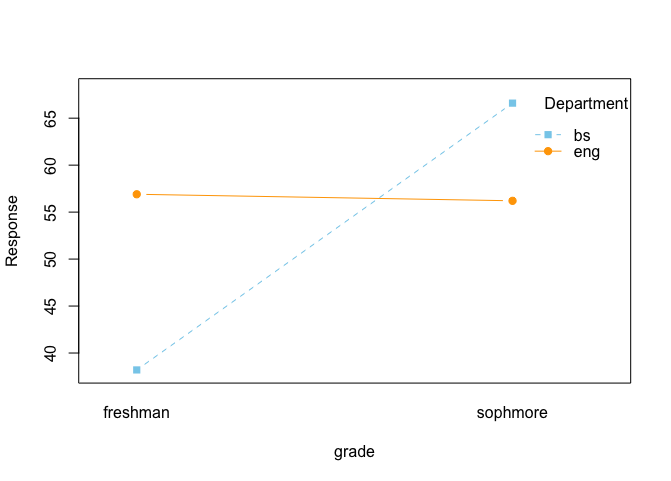
WAA06.1C: resp ~ grade * dept
# plot
interaction.plot(dat$year,  #x軸
                 dat$dept, #まとめる変数
                 dat$resp, #y軸
                 ylim = c(38,68),
                 pch = c(15,19),
                 type = "b",
                 ylab = "Response",xlab = "grade",
                 col = c("skyblue","orange"),
                 trace.label="Department"
                 )
# lm
C.lm <- lm(resp ~ year * dept,dat)
summary(C.lm)
# 出力結果
Call:
lm(formula = resp ~ year * dept, data = dat)

Residuals:
    Min      1Q  Median      3Q     Max
-26.200  -5.675  -0.200   6.100  16.800

Coefficients:
                     Estimate Std. Error t value Pr(>|t|)
(Intercept)            38.200      2.032  18.801  < 2e-16 ***
yearsophmore           28.400      2.873   9.884 2.76e-15 ***
depteng                18.700      2.873   6.508 7.31e-09 ***
yearsophmore:depteng  -29.100      4.064  -7.161 4.36e-10 ***
---
Signif. codes:  0 ‘***’ 0.001 ‘**’ 0.01 ‘*’ 0.05 ‘.’ 0.1 ‘ ’ 1

Residual standard error: 9.087 on 76 degrees of freedom
Multiple R-squared:  0.5728,	Adjusted R-squared:  0.556
F-statistic: 33.97 on 3 and 76 DF,  p-value: 4.923e-14
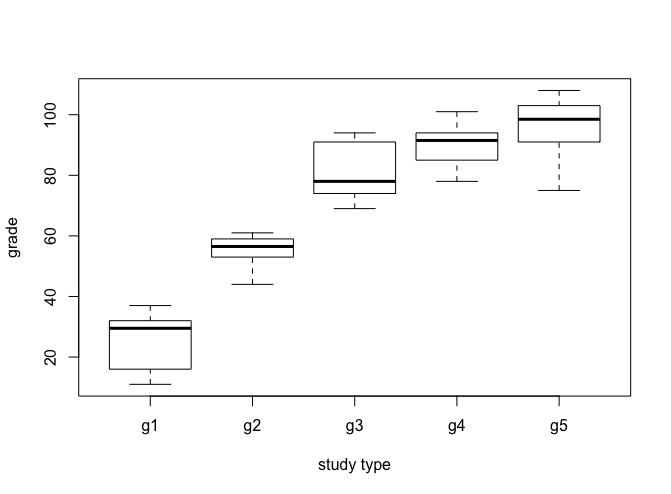
WAA07.2
dat <- read.csv("http://peach.l.chiba-u.ac.jp/course_folder/waa07_2.csv")
dat.lm <- lm(grade ~ study.type,data = dat)
summary(dat.lm)
plot(dat)
plot(dat$study.type,dat$grade,pch = 19,xlab = "study type",ylab = "grade")
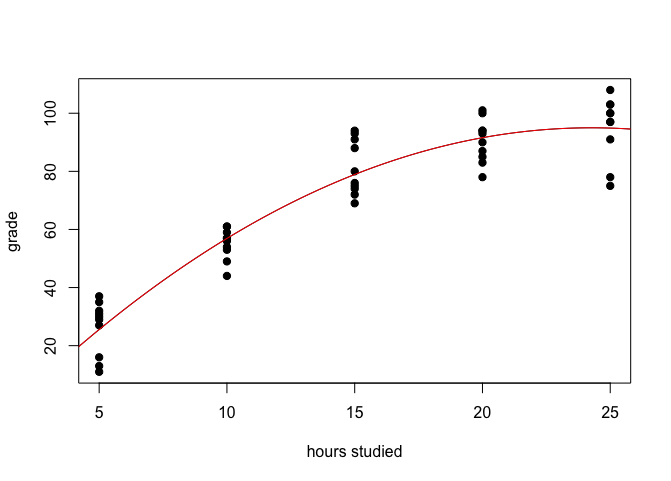
WAA07.3
# plot
plot(dat$study,dat$grade,pch = 19,xlab = "hours studied",ylab = "grade")
Twodim.lm <- lm(grade ~ study + study.sq,data = dat)
Twodim.lm.sum <- summary(Twodim.lm)
Twodim.lm.sum$coefficients[2,1]
x = seq(0,30,0.1)
y = -15.16 + 9.077*x- 0.187*x^2
lines(x,y,col = "red")