データ解析基礎論 a weekly assignment B04
WAA02
# データのinput
dat <- read.csv("http://peach.l.chiba-u.ac.jp/course_folder/waa02.csv")
head(dat)
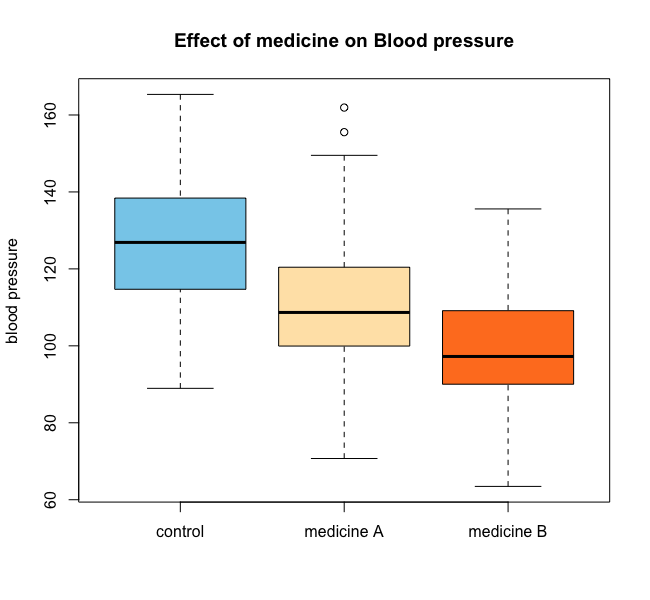
# figure1
par(mfrow=c(1,1))
plot(dat$condition,dat$blood.pressure,col = c("skyblue","moccasin","chocolate1"),
ylab = "blood pressure",main ="Effect of medicine on Blood pressure")
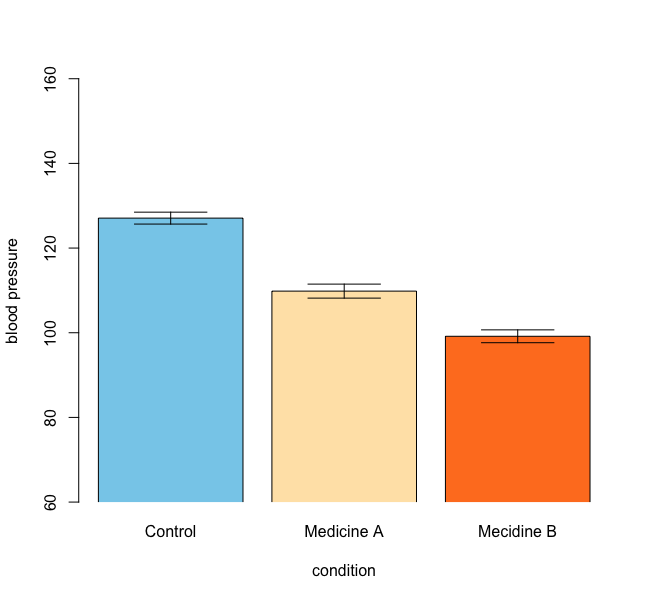
# figure2
install.packages("gplots")
library(gplots)
means <- tapply(dat$blood.pressure, dat$condition, mean)
sds <- tapply(dat$blood.pressure, dat$condition, sd)
ns <- tapply(dat$blood.pressure, dat$condition, length)
sems = sds/sqrt(ns)  #standard error (of the mean)
barplot2(means, plot.ci=T,
         ci.l = means - sems,
         ci.u = means + sems,
         ylim = c(60,160),
         names.arg = c("Control","Medicine A","Mecidine B"),
         col = c("skyblue","moccasin","chocolate1"),
         xpd = F,
         ylab = "blood pressure",
         xlab = "condition")
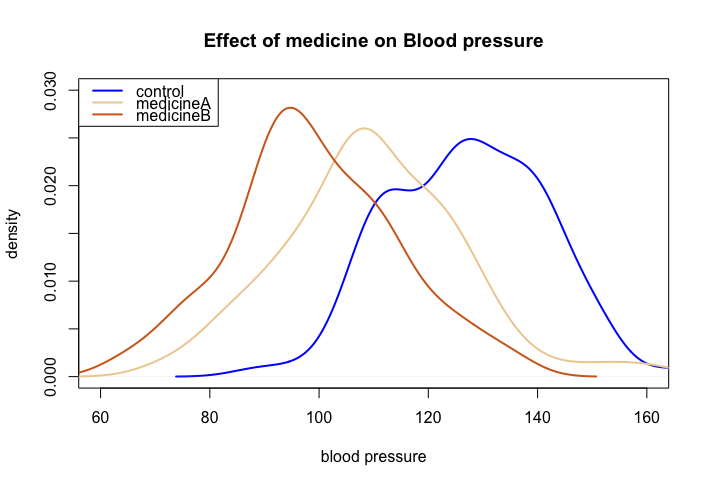
# figure3
# Densityのみの表示
plot(dens.control,col = 'blue', xlim = c(60,160),ylim = c(0,0.03),
main ="Effect of medicine on Blood pressure",lwd = 2,
xlab = "blood pressure",ylab = 'density')
lines(dens.medicineA,col = 'navajowhite2',lwd = 2)
lines(dens.medicineB,col = 'chocolate',lwd = 2)
legend("topleft", c('control','medicineA','medicineB'),
col=c('blue','navajowhite2','chocolate'),cex = 1,lwd = 2)
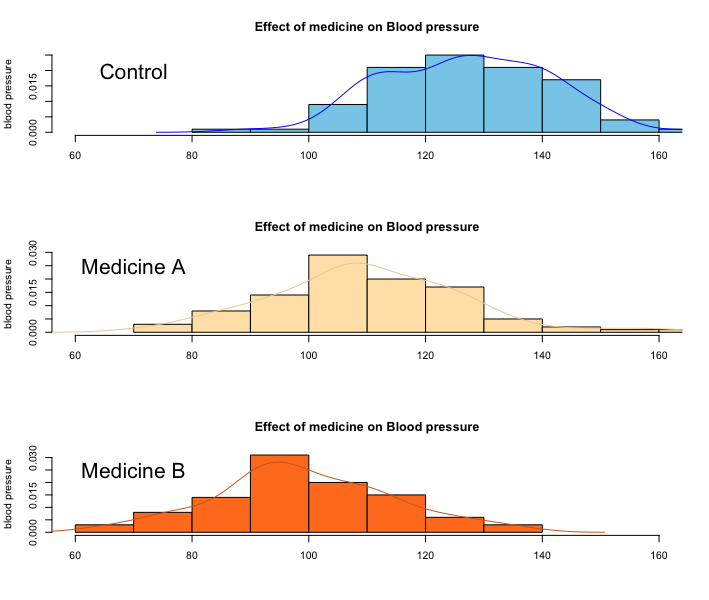
# figure4
par(mfrow=c(3,1))  #3,1に分割
# control plot
control <- dat[dat$condition == "control",]
hist(control$blood.pressure,col = "skyblue",
     ylab = "blood pressure",main ="Effect of medicine on Blood pressure",
     xlab = "",xlim = c(60,160),probability = T)
dens.control <- density(control$blood.pressure)
lines(dens.control,col = "blue")
text(70, 0.020, 'Control',cex=2,col = "black")

# medicineA plot
medicineA <- dat[dat$condition == "medicine A",]
hist(medicineA$blood.pressure,col = "moccasin",
     ylab = "blood pressure",main ="Effect of medicine on Blood pressure",
     xlab = "",xlim = c(60,160),probability = T)
dens.medicineA <- density(medicineA$blood.pressure)
lines(dens.medicineA,col = "navajowhite2")
text(70, 0.025, 'Medicine A',cex=2,col = "black")

# medicineB plot
medicineB <- dat[dat$condition == "medicine B",]
hist(medicineB$blood.pressure,col = "chocolate1",
     ylab = "blood pressure",main ="Effect of medicine on Blood pressure",
     xlab = "",xlim = c(60,160),probability = T)
dens.medicineB <- density(medicineB$blood.pressure)
lines(dens.medicineB,col = "chocolate")
text(70, 0.025, 'Medicine B',cex=2,col = "black")