前回の記事Matlabとカメラを接続 Kinectでリアルタイム画像を取得!でMatlabでのKinect導入については説明した。(カラー画像と深度画像を得るところまでは紹介しています)
本記事では Kinectを実際に使うためのmatlabの関数やその使い方に焦点を当てて説明しようと思う。
参考記事 Acquire Images with Kinect V2(英語版)
使用環境
- matlab 2019a
例・使い方
0.共通のこと
デバイスID
Kinectではさまざまなデータが取れるがその区別として、
1.カラー画像
2.深度画像 というようになっている
(以下でこの2つの番号を多用するので覚えておいてください)
1.Kinect V2 の検知
- imaqhwinfo
- DeviceInfo
などの関数を使ってKinect V2の情報を取得(通常使う時には必要ない)
詳しくはこの記事をMatlabとカメラを接続 Kinectでリアルタイム画像を取得!
2.Kinect V2を使った画像と体のデータを取得
(1)カラー画像のインプット
vid = videoinput('kinect',1);
(2)カラーセンサの情報を取得
(なくてもいい)
src = getselectedsource(vid);
ExprosureTime:露出時間
FrameInterval:フレーム間隔
Gain やGammaなどの値
(3)深度画像のインプット
vid2 = videoinput('kinect',2);
(4)深度センサの情報を取得
(なくてもいい)
src2 = getselectedsource(vid2);
- EnableBodyTracking
今の状態を見て、もし体が写っているようなら on、
写っていないようなら off を返す
(5)EnableBodyTrackingを on にする
src.EnableBodyTracking = 'on';
(6)深度のデータを読み取る?
start(vid2);
(7)getdata関数を利用(深度センサから情報を得る)
512×424のフレームやタイムスタンプ,メタデータが得られる。
% Get the data on the object.
[frame, ts, metaData] = getdata(vid2);
% Look at the metadata to see the parameters in the body data.
metaData
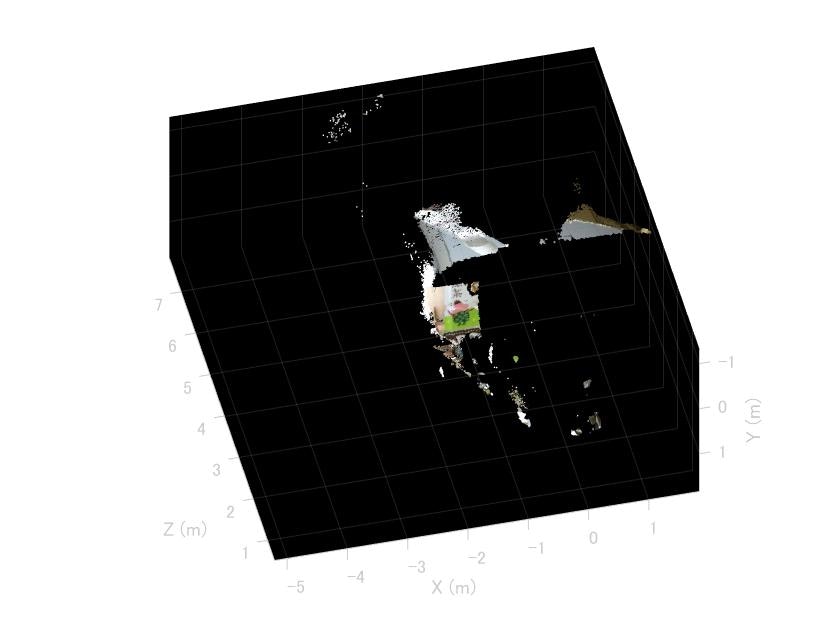
3.カラーのポイントクラウドをプロットする
(1)ビデオから1フレームを取得(この設定でカラー・深度画像のセットアップをする(必須))
  colorDevice = imaq.VideoDevice('kinect',1);
  depthDevice = imaq.VideoDevice('kinect',2);
(2)カメラの初期化とデータの取得
  colorDevice();
  depthDevice();
  colorImage = colorDevice();
  depthImage = depthDevice();
(3)Point Cloudの抽出
ptCloud = pcfromkinect(depthDevice, depthImage, colorImage);
% set appropriately to visualize the point cloud from Kinect.
  player = pcplayer(ptCloud.XLimits, ptCloud.YLimits, ptCloud.ZLimits,...
              'VerticalAxis', 'y', 'VerticalAxisDir', 'down');

  xlabel(player.Axes, 'X (m)');
  ylabel(player.Axes, 'Y (m)');
  zlabel(player.Axes, 'Z (m)');

  % Acquire and view Kinect point cloud data.
  while isOpen(player)
     colorImage = colorDevice();
     depthImage = depthDevice();

     ptCloud = pcfromkinect(depthDevice, depthImage, colorImage);

     view(player, ptCloud);
  end
ペットボトルのお茶を認識してみた↓
4.画像に骨格データを上乗せ
➀セットアップ
colorVid = videoinput('kinect', 1);
depthVid = videoinput('kinect', 2);
depthSource = getselectedsource(depthVid);
depthSource.EnableBodyTracking = 'on';
framesPerTrig = 100;
colorVid.FramesPerTrigger = framesPerTrig;
depthVid.FramesPerTrigger = framesPerTrig;
% Start the depth and color acquisition objects.
% This begins acquisition, but does not start logging of acquired data.
pause(5);
start([depthVid colorVid]);
ここまでは2の(6)までと似たような内容
➁骨格データや画像へのアクセス、取得
%カラー画像,深度画像を取得
[colorImg] = getdata(colorVid);
[~, ~, metadata] = getdata(depthVid);
%骨格と体を合成するためのマップづくり
SkeletonConnectionMap = [ [4 3];  % Neck
                          [3 21]; % Head
                          [21 2]; % Right Leg
                          [2 1];
                          [21 9];
                          [9 10];  % Hip
                          [10 11];
                          [11 12]; % Left Leg
                          [12 24];
                          [12 25];
                          [21 5];  % Spine
                          [5 6];
                          [6 7];   % Left Hand
                          [7 8];
                          [8 22];
                          [8 23];
                          [1 17];
                          [17 18];
                          [18 19];  % Right Hand
                          [19 20];
                          [1 13];
                          [13 14];
                          [14 15];
                          [15 16];
                        ];
% Extract the 90th frame and tracked body information.
lastFrame = framesPerTrig-10;
lastframeMetadata = metadata(lastFrame);

% Find the indexes of the tracked bodies.
anyBodiesTracked = any(lastframeMetadata.IsBodyTracked ~= 0);
trackedBodies = find(lastframeMetadata.IsBodyTracked);

% Find number of Skeletons tracked.
nBodies = length(trackedBodies);

% Get the joint indices of the tracked bodies with respect to the color
% image.
colorJointIndices = lastframeMetadata.ColorJointIndices(:, :, trackedBodies);

% Extract the 90th color frame.
lastColorImage = colorImg(:, :, :, lastFrame);
➂骨格データを上乗せしたRGB画像
1度に6人まで認識でき、それぞれ順に赤,緑,青,シアン,イエロー,マゼンタで表される。
colors = ['r';'g';'b';'c';'y';'m'];
imshow(lastColorImage);

% Overlay the skeleton on this RGB frame.
for i = 1:24
     for body = 1:nBodies
         X1 = [colorJointIndices(SkeletonConnectionMap(i,1),1,body) colorJointIndices(SkeletonConnectionMap(i,2),1,body)];
         Y1 = [colorJointIndices(SkeletonConnectionMap(i,1),2,body) colorJointIndices(SkeletonConnectionMap(i,2),2,body)];
         line(X1,Y1, 'LineWidth', 1.5, 'LineStyle', '-', 'Marker', '+', 'Color', colors(body));
     end

    hold on;
 end
 hold off;
関数一覧
imaqtool
Image Acquisition Toolの起動
preview
videoinputで取得したリアルタイム画像を画面上に出力する(Video Viewer)
closepreview
Video Viewerを閉じる
getselectedsource
選択したもののデータ(情報)を得る
getdata
MATLABワークスペースから画像を取得
pcplayer(Point Cloud Player)
3次元のビューアを表示(matlab上に)
構文) player=pcplayer([x軸の下限 上限],[y軸の下限 上限],[z軸の下限 上限])
例)   player = pcplayer([0 1],[0 1],[0 1]);