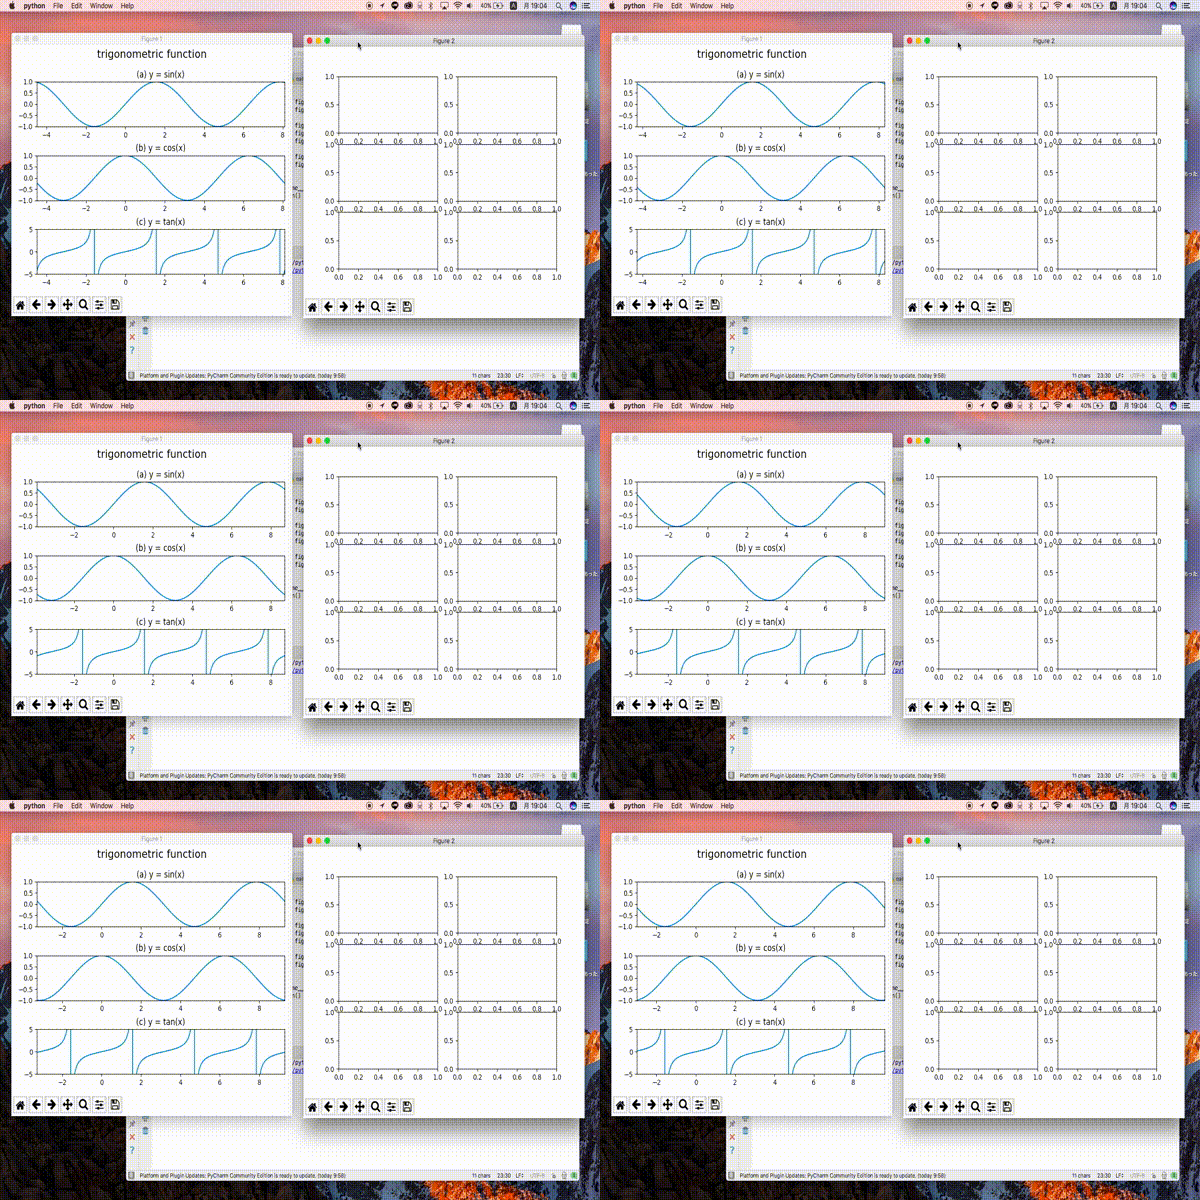
経緯
pythonでプログラムを書いていたら、
- リアルタイムに更新したい
- グラフを複数表示したい
- 1つの図にたくさんのグラフを出したい
ということがあった。
やり方がわかったのでまとめる
実行環境
python =>3.6
matplotlib =>2.0.2
とりあえずコード
とりあえず普通に sin cos tan (三角関数) をプロットするときの例
main.py
# -*- coding: utf-8 -*-
import matplotlib.pyplot as plt

import numpy as np


def main():
    x = np.linspace(-2 * np.pi, 2 * np.pi, 10000)
    y1 = np.sin(x)
    y2 = np.cos(x)
    y3 = np.tan(x)
    y4 = np.arctan(x)

    # 図1を定義
    fig1 = plt.figure()

    # タイトルをつける
    fig1.suptitle("trigonometric function", fontsize=16)

    # 図の中にサブプロットを追加する
    fig1_a = fig1.add_subplot(3, 1, 1)
    fig1_b = fig1.add_subplot(3, 1, 2)
    fig1_c = fig1.add_subplot(3, 1, 3)

    # 図1(a)にプロットする
    fig1_a_1, = fig1_a.plot(x, y1)

    # 2個以上プロットするときはこう
    # fig1_a_2, = fig1_a.plot(x, y2)

    # 図1(a)のタイトルを記入
    fig1_a.set_title("(a) y = sin(x)")

    # x軸の範囲を決める
    fig1_a.set_ylim(y1.min(), y1.max())
    fig1_a.set_xlim(x.min(), x.max())

    fig1_b_1, = fig1_b.plot(x, y2)
    fig1_b.set_title("(b) y = cos(x)")

    fig1_c_1, = fig1_c.plot(x, y3)
    fig1_c.set_ylim(-5, 5)
    fig1_c.set_title("(c) y = tan(x)")

    # 図1のタイトルと図がかぶるのでこれでOK
    fig1.tight_layout()
    fig1.subplots_adjust(top=0.85)

    # 図2を追加。図1と同じ感じでレイアウト可能
    fig2 = plt.figure()

    fig2_a = fig2.add_subplot(3, 2, 1)
    fig2_b = fig2.add_subplot(3, 2, 2)
    fig2_c = fig2.add_subplot(3, 2, 3)
    fig2_d = fig2.add_subplot(3, 2, 4)
    fig2_e = fig2.add_subplot(3, 2, 5)
    fig2_f = fig2.add_subplot(3, 2, 6)

    # 更新した値を表示する
    while True:
        plt.pause(0.1)

        x += 0.1
        y1 = np.sin(x)
        y2 = np.cos(x)
        y3 = np.tan(x)

        fig1_a_1.set_data(x, y1)
        fig1_a.set_ylim(y1.min(), y1.max())
        fig1_a.set_xlim(x.min(), x.max())

        fig1_b_1.set_data(x, y2)
        fig1_b.set_ylim(y2.min(), y2.max())
        fig1_b.set_xlim(x.min(), x.max())

        fig1_c_1.set_data(x, y3)
        fig1_c.set_xlim(x.min(), x.max())


if __name__ == '__main__':
    main()
