PrometheusのJmx_exporterを使った監視設定したのでメモ
Prometheusのインストール
公式サイトから本体をのtar.gzをダウンロードし、解凍します。
Prometheus/download
jmx_exporterのビルド
Prometheusの本体はtarを解凍して終わりなので、次にjmx_exporterの準備をします。gitからクローンをして、mvnでビルドします。 mvnが入っていない合は別途インストールが必要。
$ git clone https://github.com/prometheus/jmx_exporter.git
$ cd jmx_exporter
$ mvn package
jmx_exporterの設定
設定ファイル、httpserver_sample_config.ymlを編集する。Hostport部分をjmxが動いているサーバ、ポートに変更する。
---
hostPort: yourserver:jmxport
username:
password:

rules:
- pattern: ".*"
jmx_exporterの起動
run_sample_httpserver.shここを参考に起動用スクリプトを作る。もし、jmx_exporterの起動しているポートを変えたいのならここのコマンドの5555部分を変更する。
起動してブラウザ経由で5555ポートにアクセスしてそれっぽいレスポンスが取れていればOK。
prometeusの設定
prometheusのコンフィグに、追加したjmx_exporterの情報を追記する。
jmx_exporterを今回はローカルホストの5555ポートで起動したので、static_configのtargetにlocalhost,5555を追記します。
# A scrape configuration containing exactly one endpoint to scrape:
# Here it's Prometheus itself.
scrape_configs:
  # The job name is added as a label `job=<job_name>` to any timeseries scraped from this config.
  - job_name: 'prometheus'

    # metrics_path defaults to '/metrics'
    # scheme defaults to 'http'.

    static_configs:
    - targets: ['localhost:9090']
    - targets: ['localhost:5555']
prometheusを起動する。
解凍したディレクトリに起動コマンドがあるので、設定ファイルを指定して起動する。
./prometheus --config.file="prometheus.yml"
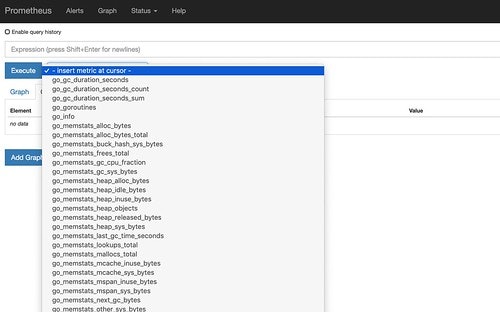
こんなのが見えればOK。 簡単簡単。
あとはまぁ、本番環境用に色々やるんだけど、それは別のお話。
Solrを結構使うんですが、その細かい指標を自動で拾ってくれて、グラフにできるのがめちゃくちゃ便利でよい。現状はzabbixを使ってるんだけど、グラフをいじったりするときに、プレミアム会員の退会フローかよ!と思うことが....
もう少し調べてzabbixを入れ替えるぐらいまでいけたらいいなー。