Juliaで何かをプロットする時に何かいいものがないかと探していました。
そして、Makie.jlを発見しました。
https://github.com/JuliaPlots/Makie.jl
マニュアルは
http://makie.juliaplots.org/stable/index.html
にあります。
これを使うと非常に綺麗なプロットを作ることができます。特に、3次元プロットが綺麗です。
Julia 1.0.0でインストールする際に少し詰まった部分があったので、そこを解消する方法を記します。
インストール
Makie.jlのインストールをするには、AbstractPlotting.jlとGLMakie.jlが必要らしいので、]を押してパッケージモードにしてから
add AbstractPlotting#master Makie#master GLMakie#master
として、三つをインストールします。
もしMakieだけをインストールしてしまうと、
../assets/icons: No such file or directory
みたいなエラーが出ます。このエラーが出てしまっている時は、GLMakieが入っていないようです。
参考URL:
https://github.com/JuliaPlots/Makie.jl/issues/261
さらに、作った図を保存する際に、チュートリアル通りにやろうとするとエラーが出ます。これは、FileIOが必要なためで、
]を押してパッケージモードで
add FileIO
として入れてください。そして、using FileIOをするとsaveでファイルが保存できるようになります。
グラフの例(マニュアルにあるグラフ)
まずはじめに、マニュアルにあるグラフをプロットしてみましょう。
立体
立体のグラフの例を示します。
using Makie
using FileIO
v1 = volume(rand(32, 32, 32), algorithm = :mip)
save("volume.png", v1)
表面プロット
表面プロット(いわゆる色付きの3Dグラフ)は、
using Makie
using FileIO

using Makie

N = 51
x = range(-2, stop = 2, length = N)
y = x
z = (-x .* exp.(-x .^ 2 .- (y') .^ 2)) .* 4

scene = wireframe(x, y, z)
xm, ym, zm = minimum(scene.limits[])
scene = surface!(scene, x, y, z .+ 0.05)
contour!(scene, x, y, z, levels = 15, linewidth = 2, transformation = (:xy, zm))
save("surface.png",scene)
となります。ここで、保存する際にはsceneを指定しています。
等値面の3Dプロット
等値面は
using Makie
using LinearAlgebra
using FileIO

function test(x, y, z)
    xy = [x, y, z]
    ((xy') * Matrix(I, 3, 3) * xy) / 20
end
x = range(-2pi, stop = 2pi, length = 100)
scene = Scene()
c = contour!(scene, x, x, x, test, levels = 6, alpha = 0.3)[end]
xm, ym, zm = minimum(scene.limits[])
 # c[4] == fourth argument of the above plotting command
contour!(scene, x, x, map(v-> v[1, :, :], c[4]), transformation = (:xy, zm), linewidth = 10)
heatmap!(scene, x, x, map(v-> v[:, 1, :], c[4]), transformation = (:xz, ym))
contour!(scene, x, x, map(v-> v[:, :, 1], c[4]), fillrange = true, transformation = (:yz, xm))
save("v2.png", c)
で描くことができて、出来上がるグラフは

となります。この立体はJuliaを起動してから実行するとグルグルマウスで回せます(Macで確認)。
球の上の矢印
using Makie
using FileIO

using LinearAlgebra

n = 20
f   = (x,y,z) -> x*exp(cos(y)*z)
∇f  = (x,y,z) -> Point3f0(exp(cos(y)*z), -sin(y)*z*x*exp(cos(y)*z), x*cos(y)*exp(cos(y)*z))
∇ˢf = (x,y,z) -> ∇f(x,y,z) - Point3f0(x,y,z)*dot(Point3f0(x,y,z), ∇f(x,y,z))

θ = [0;(0.5:n-0.5)/n;1]
φ = [(0:2n-2)*2/(2n-1);2]
x = [cospi(φ)*sinpi(θ) for θ in θ, φ in φ]
y = [sinpi(φ)*sinpi(θ) for θ in θ, φ in φ]
z = [cospi(θ) for θ in θ, φ in φ]

pts = vec(Point3f0.(x, y, z))
∇ˢF = vec(∇ˢf.(x, y, z)) .* 0.1f0
scene = surface(x, y, z)
arrows!(
    pts, ∇ˢF,
    arrowsize = 0.03, linecolor = (:white, 0.6), linewidth = 3
)
save("sp.png",scene)
となります。
図は、
棒グラフ
棒グラフは
using Makie
using FileIO

scene = barplot(rand(10), color = rand(10))
save("bar.png",scene)
その他
そのほかにも様々なグラフが
http://makie.juliaplots.org/stable/functions-overview.html
にあります。
グラフの例
ここからは、自分で作ってみたものをお見せします。
等値面一つだけ
等値面のうち、一つだけプロットしたい時は、
using Makie
using FileIO

using LinearAlgebra

function test(x, y, z)
    return cos(x)+cos(y)+cos(z)
end
x = range(-π, stop = π, length = 100)
scene = Scene()
contour!(scene, x, x, x, test, levels = [0], alpha = 0.3)
save("tb.png",scene)
とします。ここで、levels=[0]は値が0の等値面を描く、ということになっています。
得られた図は
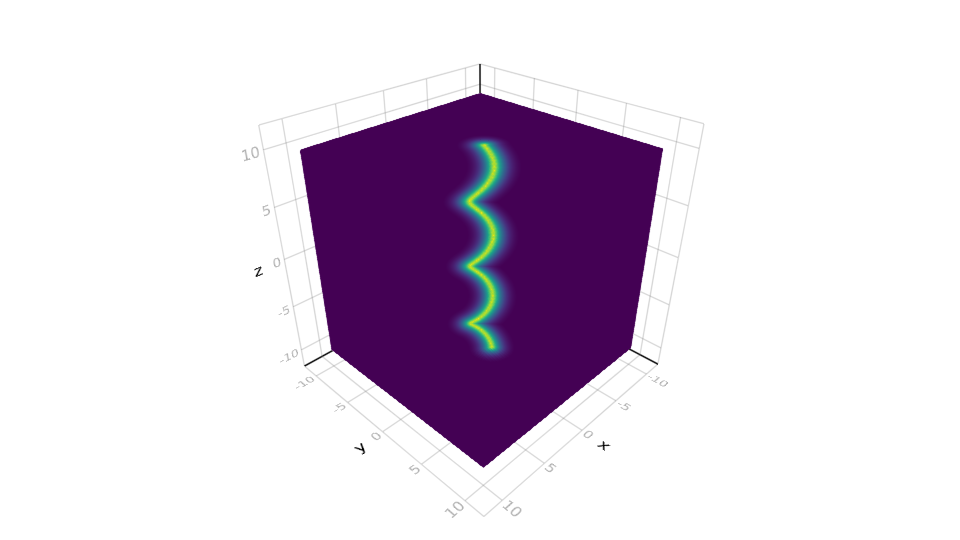
濃度分布
3D中の濃度分布をプロットしてみます。
コードは
using Makie
using FileIO
N=32
x = range(-10, stop = 10, length = 100)
function vor(x,y,z)
    shift = cos(z)
    shift2 = sin(z)
    r = sqrt((x-shift)^2+(y-shift2)^2)
    return 1-tanh(r)
end
v2 = volume(x,x,x,vor, algorithm = :mip)
save("vortex.png", v2)
です。
これを実行すると、


