概要
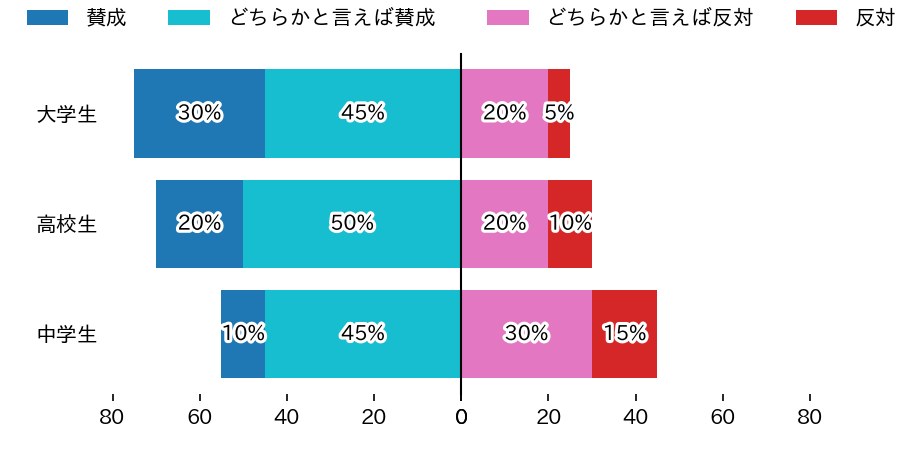
次のような正方向と負方向の両方向に対応した積み上げグラフを作成します。
動作を確認した環境
Google Colab. で作成・動作確認しました。
python     version 3.6.9
numpy      version 1.18.5
pandas     version 1.1.2
matplotlib version 3.2.2
準備
matplotlibグラフのなかで日本語が使えるようにします。
!pip install japanize_matplotlib
ライブラリを読み込みます。
%reset -f
import sys
import pandas as pd
import numpy as np
import japanize_matplotlib
import matplotlib
import matplotlib.pyplot as plt
import matplotlib.patheffects as pe
pv = '.'.join([ str(v) for v in sys.version_info[:3] ])
print(f'python     version {pv}')
print(f'numpy      version {np.__version__}')
print(f'pandas     version {pd.__version__}')
print(f'matplotlib version {matplotlib.__version__}')
サンプルデータを準備します。
df = pd.DataFrame()
df['区分']=['中学生','高校生','大学生']
df['賛成']=[10,20,30]
df['どちらかと言えば賛成']=[45,50,45]
df['どちらかと言えば反対']=[30,20,20]
df['反対']=[15,10,5]
display(df)
このデータについて「賛成」と「どちらかと言えば賛成」を左側に、「どちらかと言えば反対」と「反対」を右側に積み上げていきます。
コード
def draw(df, y_column,x_columns,colors,x_range):

  left_columns ,right_columns = x_columns
  left_colors,right_colors = colors

  # 1行2列のグラフを作成
  fig,ax = plt.subplots(nrows=1, ncols=2, figsize=(6,3), facecolor='white',sharey='row',dpi=150)

  # 枠線を消す
  for a in ax:
    for x in ['top','bottom','left','right']:
      a.spines[x].set_visible(False)
      a.tick_params(axis='y',left=False)

  # 左側のグラフ
  acc = np.zeros(len(df))
  for colum,color in reversed(list(zip(left_columns ,left_colors))):
    s = df[colum]
    ax[0].barh(df[y_column],s,left=acc,color=color,label=colum)
    for i in range(len(df)):
      t = ax[0].text(acc[i]+s[i]/2,i,f'{s[i]}%', ha='center',va='center')
      t.set_path_effects([pe.Stroke(linewidth=3, foreground='white'), pe.Normal()])
    acc+=s

  # 右側のグラフ
  acc = np.zeros(len(df))
  for colum,color in zip(right_columns,right_colors):
    s = df[colum]
    ax[1].barh(df[y_column],s,left=acc,color=color,label=colum)
    for i in range(len(df)):
      t = ax[1].text(acc[i]+s[i]/2,i,f'{s[i]}%', ha='center',va='center')
      t.set_path_effects([pe.Stroke(linewidth=3, foreground='white'), pe.Normal()])
    acc+=s

  # 凡例
  ha,la = ax[0].get_legend_handles_labels()
  ax[0].legend(reversed(ha),reversed(la),bbox_to_anchor=(0.95, 1.05), loc='lower right',ncol=len(left_columns), borderaxespad=0,frameon=False)
  ax[1].legend(bbox_to_anchor=(0.05, 1.05), loc='lower left',ncol=len(right_columns), borderaxespad=0,frameon=False)

  # 中心に線を引く
  ax[1].axvline(x=0,ymin=0,ymax=1,clip_on=False,color='black',lw=1)

  ax[0].set_xlim(x_range[0],0) # 左側グラフはX軸を反転
  ax[1].set_xlim(0,x_range[1])

  fig.subplots_adjust(wspace=0.0) # 左右のグラフの間隔をゼロに設定
  plt.savefig('test.png')
  plt.show()

# サンプルデータを与えてグラフを作成
draw(df,'区分',
     [['賛成','どちらかと言えば賛成'],['どちらかと言えば反対','反対']],
     [['tab:blue','tab:cyan'],['tab:pink','tab:red']],[80,80])

