概要
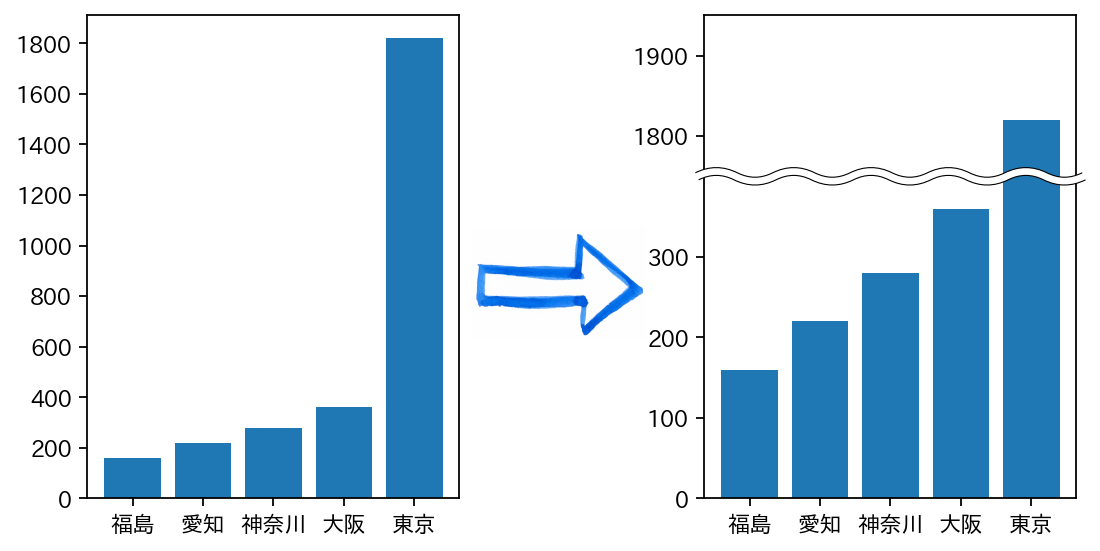
様々な大人の事情により、グラフの途中を波線で省略したいことがあります。matplotlib を使って、このようなグラフを作成するための方法についての解説です。
実行環境
Python 3.6.9(Google Colab.環境)で実行・動作確認をしています。
実行環境
japanize-matplotlib      1.0.5
matplotlib               3.1.3
matplotlib-venn          0.11.5
グラフで日本語を使うための準備
Google Colab.環境のなかで、matplotlib を日本語対応させるためには次のようにします。
グラフのなかで日本語を使うための準備
!pip install japanize-matplotlib
import japanize_matplotlib
普通に棒グラフを作成する
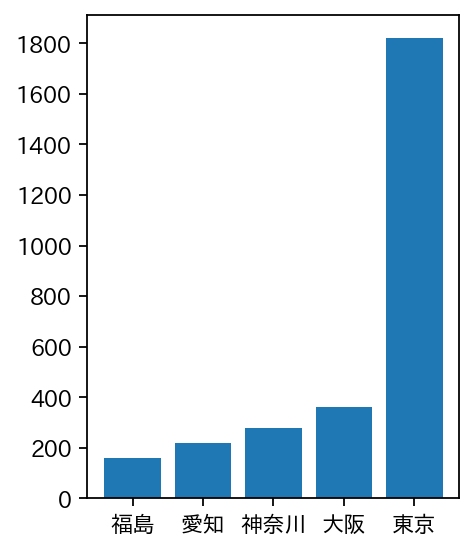
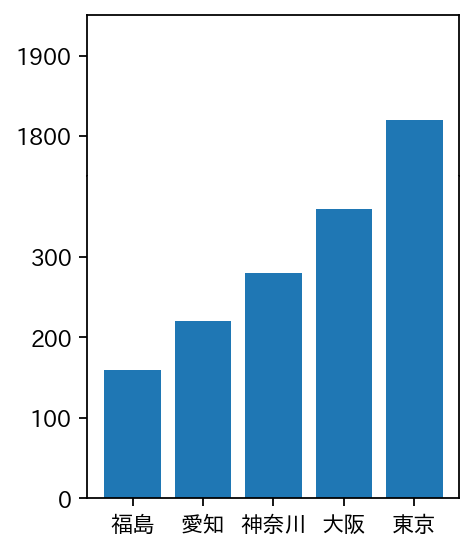
まずは、普通に棒グラフを描いてみます。
普通に棒グラフを作成する
left   = np.array(['福島', '愛知', '神奈川', '大阪', '東京'])
height = np.array([160, 220, 280, 360, 1820])

plt.figure(figsize=(3,4), dpi=160)
plt.bar(left,height) # 棒グラフ
plt.yticks(np.arange(0,1800+1,200))    # X軸目盛を0から1900まで200刻み
plt.gcf().patch.set_facecolor('white') # 背景色を「白」に設定
実行結果は次のようになります。東京の突出具合が非常に目立っています。
波線で途中を省略した棒グラフを作成する
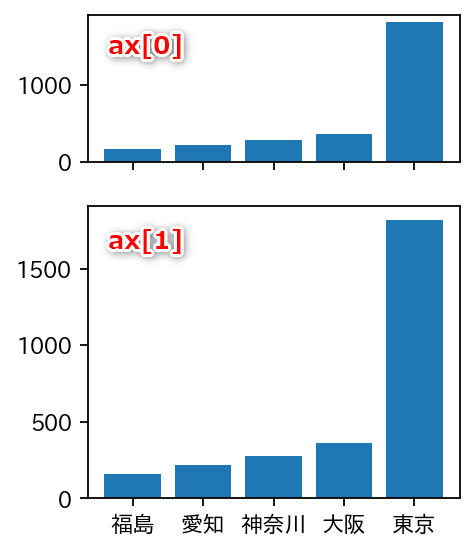
ステップ1 サブプロットで上下に同じ棒グラフをならべる
Step.1
import numpy as np
import matplotlib.pyplot as plt
import matplotlib.patches as mpatches
from matplotlib.path import Path

left   = np.array(['福島', '愛知', '神奈川', '大阪', '東京'])
height = np.array([160, 220, 280, 360, 1820])

# サブプロット2行1列のサブプロットを用意
fig, ax = plt.subplots(nrows=2, figsize=(3,4), dpi=160, sharex='col',
                       gridspec_kw={'height_ratios': (1,2)} )

fig.patch.set_facecolor('white') # 背景色を「白」に設定

ax[0].bar(left,height) # 上段
ax[1].bar(left,height) # 下段
gridspec_kw={'height_ratios': (1,2)} で、上下の高さ比率が $1:2$ になるように設定しています。実行結果は次のようになります。
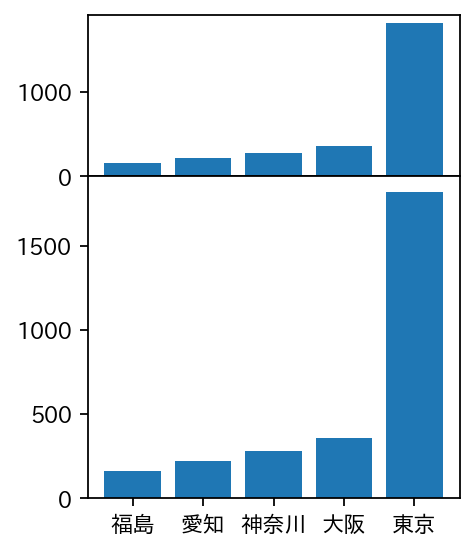
ステップ2 上下のグラフをくっつける
上下のサブプロット間に隙間があるので、これを消していきます。
Step.2
# サブプロット間の上下間隔をゼロに設定
fig.subplots_adjust(hspace=0.0)
実行結果は次のようになります。
ステップ3 境界線を消してY軸範囲を上下で個別に設定する
上下グラフの境界線(=上段サブプロットの底辺、下段サブプロットの上辺)を非表示にします。また、各サブプロットのY軸の表示範囲や目盛を設定します。この際、サブプロット同士の Y軸表示範囲の比率 が、Step.1で指定した 'height_ratios': (1,2) と同じになるようにします。
Step.3
# 下段サブプロット
ax[1].set_ylim(0,400)  # 区間幅 400
ax[1].set_yticks(np.arange(0,300+1,100))

# 上段サブプロット
ax[0].set_ylim(1750,1950)  # 区間幅 200
ax[0].set_yticks((1800,1900))

# 下段のプロット領域上辺を非表示
ax[1].spines['top'].set_visible(False)

# 上段のプロット領域底辺を非表示、X軸の目盛とラベルを非表示
ax[0].spines['bottom'].set_visible(False)
ax[0].tick_params(axis='x', which='both', bottom=False, labelbottom=False)
実行結果は次のようになります。
ステップ4 ニョロ線を描く
途中区間を省略していることを表わすニョロ(波線)を描いていきます。
Step.4
d1 = 0.02 # X軸のはみだし量
d2 = 0.03 # ニョロ波の高さ
wn = 21   # ニョロ波の数(奇数値を指定)

pp = (0,d2,0,-d2)
px = np.linspace(-d1,1+d1,wn)
py = np.array([1+pp[i%4] for i in range(0,wn)])
p = Path(list(zip(px,py)), [Path.MOVETO]+[Path.CURVE3]*(wn-1))

line1 = mpatches.PathPatch(p, lw=4, edgecolor='black',
                          facecolor='None', clip_on=False,
                          transform=ax[1].transAxes, zorder=10)

line2 = mpatches.PathPatch(p,lw=3, edgecolor='white',
                           facecolor='None', clip_on=False,
                           transform=ax[1].transAxes, zorder=10,
                           capstyle='round')

a = ax[1].add_patch(line1)
a = ax[1].add_patch(line2)
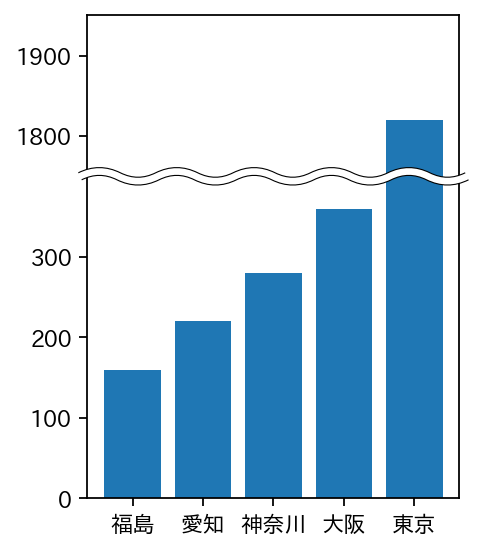
実行結果は次のようになります。
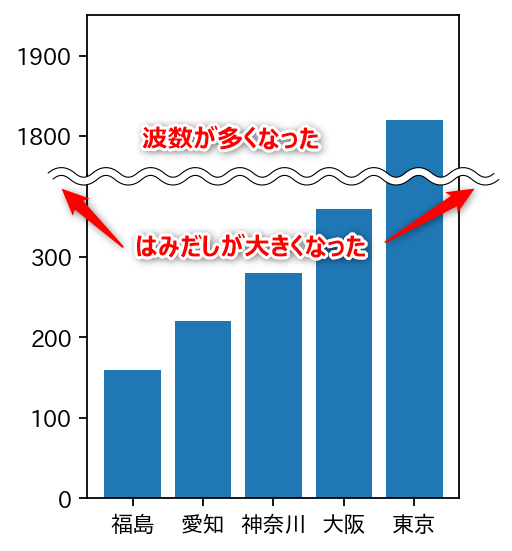
描画パラメータを d1 = 0.1、wn = 41 のように設定すると次のようになります。
全体コード
全体コード
%reset -f
import numpy as np
import matplotlib.pyplot as plt
import matplotlib.patches as mpatches
from matplotlib.path import Path

left   = np.array(['福島', '愛知', '神奈川', '大阪', '東京'])
height = np.array([160, 220, 280, 360, 1820])

# サブプロット2行1列のサブプロットを用意
fig, ax = plt.subplots(nrows=2, figsize=(3,4), dpi=160, sharex='col',
                       gridspec_kw={'height_ratios': (1,2)} )

fig.patch.set_facecolor('white') # 背景色を「白」に設定

ax[0].bar(left,height) # 上段
ax[1].bar(left,height) # 下段

# サブプロット間の上下間隔をゼロに設定
fig.subplots_adjust(hspace=0.0)

# 下段サブプロット
ax[1].set_ylim(0,400)  # 区間幅 400
ax[1].set_yticks(np.arange(0,300+1,100))

# 上段サブプロット
ax[0].set_ylim(1750,1950)  # 区間幅 200
ax[0].set_yticks((1800,1900))

# 下段のプロット領域上辺を非表示
ax[1].spines['top'].set_visible(False)

# 上段のプロット領域底辺を非表示、X軸の目盛とラベルを非表示
ax[0].spines['bottom'].set_visible(False)
ax[0].tick_params(axis='x', which='both', bottom=False, labelbottom=False)

## ニョロ線の描画
d1 = 0.02 # X軸のはみだし量
d2 = 0.03 # ニョロ波の高さ
wn = 21   # ニョロ波の数(奇数値を指定)

pp = (0,d2,0,-d2)
px = np.linspace(-d1,1+d1,wn)
py = np.array([1+pp[i%4] for i in range(0,wn)])
p = Path(list(zip(px,py)), [Path.MOVETO]+[Path.CURVE3]*(wn-1))

line1 = mpatches.PathPatch(p, lw=4, edgecolor='black',
                          facecolor='None', clip_on=False,
                          transform=ax[1].transAxes, zorder=10)

line2 = mpatches.PathPatch(p,lw=3, edgecolor='white',
                           facecolor='None', clip_on=False,
                           transform=ax[1].transAxes, zorder=10,
                           capstyle='round')

a = ax[1].add_patch(line1)
a = ax[1].add_patch(line2)