概要
C3.js を使って可変数のグラフを動的に描画するサンプルが見つからなかったので後世のために記しておきます。
以下の要件を実現しているので必要であれば参考にしてください。
なお、JavaScriptはES6で記述しているので動作を確認するときは対応しているブラウザで実行してください。
- 配列の要素数に応じて動的にグラグを描画する
- データ形式がJSON
- 横軸が時間(10分刻み)
サンプルコード
GitHubの以下のリポジトリでコードを公開しているので必要ならば参照ください。
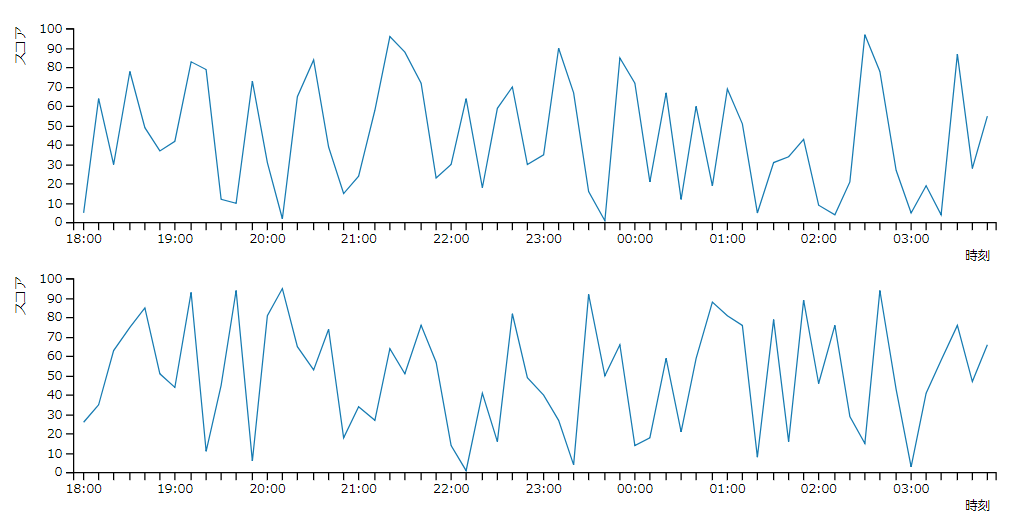
描画イメージ
実装
HTML
ビルドツールでビルドして色々やるのが面倒だったので結構手を抜いています。
<!DOCTYPE html>
<html lang="jp">
<head>
  <meta charset="UTF-8">
  <title>C3サンプル</title>

  <link rel="stylesheet" href="bower_components/c3/c3.min.css">

  <script type="text/javascript" src="bower_components/d3/d3.min.js"></script>
  <script type="text/javascript" src="bower_components/c3/c3.min.js"></script>
  <script type="text/javascript" src="js/app.js"></script>
</head>
<body>
  <h1 style="margin-bottom: 30px">C3サンプル</h1>

  <div id="chart-parent"></div>
</body>
</html>
JavaScript
メイン処理部
#chart-parent の子要素として3~10のdivタグを追加し、それぞれにC3のグラフを描画します。
const addMinutes = (time, minutes) => {
  const result = new Date(
    time.getFullYear(), time.getMonth(), time.getDate(), time.getHours(), time.getMinutes()
  );
  result.setMinutes(result.getMinutes() + minutes);
  return result;
};

window.onload = () => {
  const n = Math.floor(Math.random() * 8) + 3;

  const fragment = document.createDocumentFragment();
  for (let i = 1; i <= n; i++) {
    const div = document.createElement('div');
    div.id = `chart${i}`;
    fragment.appendChild(div);
  }
  const parent = document.querySelector('#chart-parent');
  parent.appendChild(fragment);

  const startAt = addMinutes(new Date(), -600);
  startAt.setMinutes(0);

  const generator = new C3Generator();
  for (let i = 1; i <= n; i++) {
    generator.drawChart(`#chart${i}`, startAt);
  }
};
C3でのグラフ描画
C3での描画処理の実装。
実行時刻から10時間遡った時間より10分刻みで60のポイントを生成してC3でグラフ描画を行っています。
class C3Generator {
  generateScore(startAt) {
    const scores = [];
    for (let i = 1; i <= 60; i++) {
      scores.push(Math.floor(Math.random() * 100) + 1);
    }

    return scores.map((s, index) => {
      return {time: addMinutes(startAt, 10 * index), score: s};
    });
  }

  drawChart(element, startAt) {
    const score = this.generateScore(startAt);
    return c3.generate({
      bindto: element,
      data: {
        json: score,
        keys: {
          x: 'time',
          value: ['score']
        }
      },
      axis: {
        x: {
          label: {
            text: '時刻',
            position: 'outer-right',
          },
          type: 'timeseries',
          tick: {
            format: '%H:%M',
            culling: {
              max: 11 // to 1 hour interval
            }
          }
        },
        y: {
          max: 100,
          min: 0,
          label: {
            text: 'スコア',
            position: 'outer-right'
          },
          padding: {
            top: 0,
            bottom: 0
          }
        }
      },
      legend: {
        show: false
      },
      size: {
        width: 800,
        height: 200
      },
      point: {
        show: false,
      },
      zoom: {
        enabled: true,
      },
    });
  }
}