はじめに
ログ収集ツールには様々な選択肢がありますが、その中でもFluentdやFluent Bitを利用した経験がある方もいらっしゃるのではないでしょうか。特にFluent Bitは、軽量でシンプルな設計が特徴で、リソースが限られた環境でも運用しやすいツールとして注目されています。
さらに、Fluentdと同様に独自プラグインを開発できるなど、ユーザ側のカスタマイズ性が高い点も大きな特徴です。これにより、様々なニーズに合わせた柔軟なログ収集パイプラインを構築することが可能です。
一方で、開発や運用中に、ログが正常に収集されているか、どの程度リソースが使われているかなど、様々なメトリクスを監視したいと思うことも多いのではないでしょうか。
本記事では、GrafanaとPrometheusを使ってサクッとFluent Bitのデータパイプラインを監視する方法をご紹介します。
Fluent Bitのメトリクスについて
Fluent Bitは自身のパイプラインに関するメトリクスを提供してくれています。実際にどんなメトリクスを提供しているかは公式ドキュメントをご参照ください。
Fluent Bitの設定ファイルを準備
今回は、適当にCPU使用率(cpu)を内部メトリクスに基づいて監視したいと思います。
Prometheus Exporterはメトリクスプラグインのみでしか動作しないことに注意してください。
[SERVICE]
    flush           1
    log_level       info

[INPUT]
    name            fluentbit_metrics
    tag             internal_metrics
    scrape_interval 5

[INPUT]
    name            cpu
    tag             cpu_metrics
    interval_sec    5

[OUTPUT]
    name            prometheus_exporter
    match           *
    host            0.0.0.0
    port            2021
Prometheusの設定ファイルの準備
なるべくリアルタイムで監視したいので、収集間隔を5秒にしておきます。また今回は同一のDockerネットワーク内で動かすため、targetsの箇所をcomposeファイルのサービス名と合わせます。
global:
  scrape_interval: 5s

scrape_configs:
  - job_name: "fluentbit"
    static_configs:
      - targets: ["fluentbit:2021"]
Docker Composeの準備
こんな感じでcomposeファイルを準備します。なんとなくFluent Bitはdebugありのイメージを持ってきています。リリース版はDistoless imageゆえにshellなどがないのでご注意ください。
version: '3.8'
services:
  fluentbit:
    image: fluent/fluent-bit:3.0.3-debug
    ports:
      - "2021:2021"
    volumes:
      - "./fluent-bit.conf:/fluent-bit/etc/fluent-bit.conf"
    command: ["/fluent-bit/bin/fluent-bit", "-c", "/fluent-bit/etc/fluent-bit.conf"]

  prometheus:
    image: prom/prometheus:latest
    ports:
      - "9090:9090"
    volumes:
      - "./prometheus.yaml:/etc/prometheus/prometheus.yaml"

  grafana:
    image: grafana/grafana:latest
    ports:
      - "3000:3000"
    environment:
      - GF_SECURITY_ADMIN_USER=admin # ここはお好きに
      - GF_SECURITY_ADMIN_PASSWORD=admin # ここもお好きにどうぞ。どうせローカルです。
    volumes:
      - grafana-data:/var/lib/grafana

volumes:
  grafana-data:
環境を立ち上げる
以下のようなディレクトリ構造でファイルを配置し、環境を立ち上げます。
$ tree .
.
├── compose.yaml
├── fluent-bit.conf
└── prometheus.yaml
$ docker compose up -d
Grafana上で監視する
localhost:3000に繋ぐとGrafanaが起動しているので確認しに行きましょう。初回起動時には、ユーザ名とパスワードが求められるので、上のcomposeファイルで設定したパラメータを入力します。
今回の場合だと両方adminです。
ログインできたら、パスワードを変えろとか言ってきますが、所詮ローカルなので無視します。
左らへんにあるData Sourcesを選択後、Add new Data sourceを選択。
connectionの箇所にprometheusのURLを記載します。
今回の場合だとhttp://prometheus:9090です。

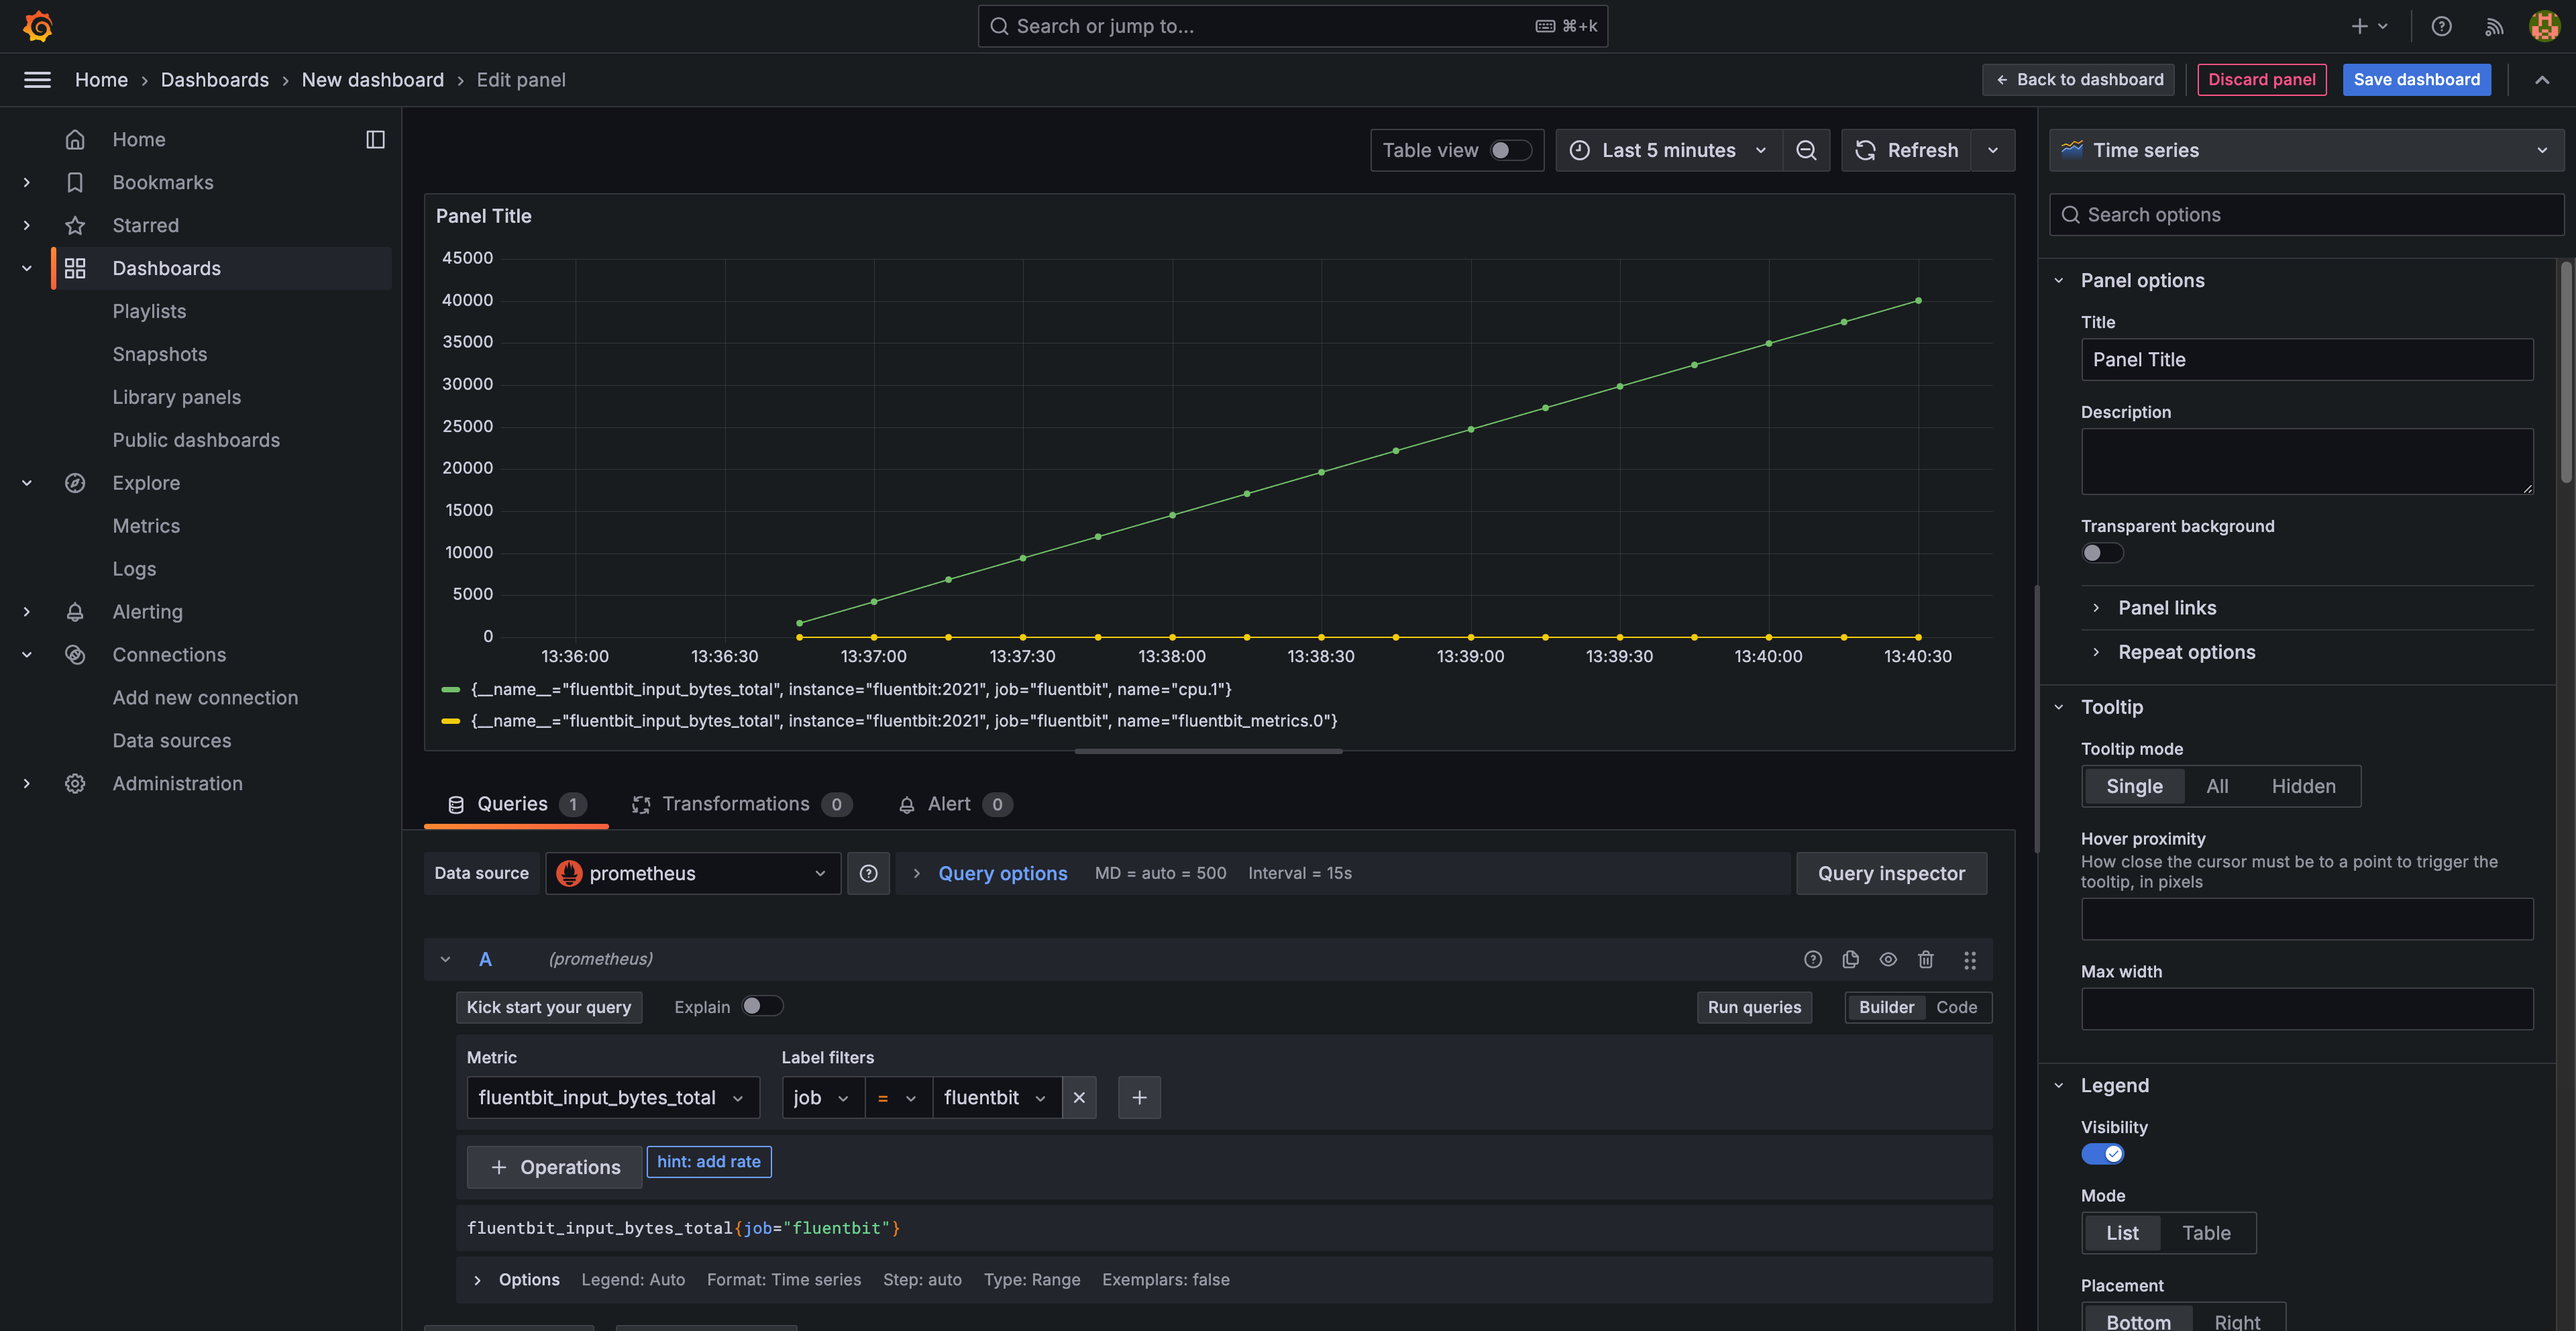
あとはDashboardsのセクションからお好きなメトリクスを監視するダッシュボードを作るだけです。

こんな感じの良さげなグラフができます。PromQLも使えて便利!

公式配布されている設定ファイルを読み込むとなんかいい感じになります。(どうやらKubernetes用の設定ファイルっぽいのでグラフ上の箇所がちゃんと読み取れてなさそう)

参考
