その1はこちら
その2はこちら
ヘルシンキ大学の教材のWeek5-Week6の解答と補足をまとめていきます。
Week5
5-1 静的な地図の作成
Week5では元のnotebookが存在せず、GithubのREADMEを読んだ上で、自身で適当な題材を選び地図をビジュアライズすることが求められます。
5-2 動的な地図の作成
Week6
6-1 店の場所を推測する
Week6の前半ではOSM(オープンストリートマップ)を活用して、あらかじめ与えられた移動データの出発地点・到着地点を推測するという作業を行います。mplleafletライブラリによってmatplotlibで作成した図形をインタラクティブ地図上にプロットできます。(mplleafletについてはこちらの記事が詳しいです。)mplleaflet単体では画像の保存ができないため、スクリーンショットなどを用いて画像保存する必要があります。
# データの読み込み
origin = pd.read_csv('data/origins.csv') #出発地
dest = pd.read_csv('data/destinations.csv') #到着地
# ポイント化
make_point = lambda row:Point(row['x'], row['y'])
origin['geometry'] = origin.apply(make_point, axis=1)
dest['geometry'] = dest.apply(make_point, axis=1)
origin_geo = gpd.GeoDataFrame(origin, geometry='geometry')
dest_geo = gpd.GeoDataFrame(dest, geometry='geometry')
# 座標系の定義と変換
rigin_geo.crs = CRS.from_epsg(3857)
dest_geo.crs = CRS.from_epsg(3857)
origin_geo = origin_geo.to_crs(CRS.from_epsg(3857))
dest_geo = dest_geo.to_crs(CRS.from_epsg(3857))
# プロット
fig, ax = plt.subplots(figsize=(12,8))
origin_geo.plot(ax=ax)
dest_geo.plot(ax=ax)
mplleaflet.show() #地図と合成させる

エストニアの首都タリン近辺にポイントが集まっていることが分かります。ジオコーディングによって確認しましょう。
6-2 タリンのネットワーク解析
6-1で得た出発点、到着点の間のルート・道のり距離を求めるのが目標です。
①OSMの道路データを基に、osmxライブラリを用いてグラフに変換
②出発点・到着店をグラフの最寄りのノードに近似
③networkxでノード間最短ルートを作成し、その長さを求める
という順で作業を行います。
# 全てのポイントを包含する凸包の作成
merged = pd.concat([origin, dest])
make_p = lambda row: (row['geometry'].x, row['geometry'].y)
merged['p'] = merged.apply(make_p, axis=1)
list_point = merged['p'].values.tolist()
multi = MultiPoint(list_point)
extent = multi.convex_hull
# グラフの抽出
import osmnx as ox
graph = ox.graph_from_polygon(extent, network_type='drive')
# グラフからノードとリンクを作成
nodes_proj, edges_proj = ox.graph_to_gdfs(graph_proj, nodes=True, edges=True)
# ポイントのノードへの近似
graph_proj = ox.project_graph(graph)
orig_nodes = []
for orig in origin_geo['geometry']:
    orig_xy = (orig.y, orig.x)
    orig_node = ox.get_nearest_node(graph, orig_xy)
    orig_nodes.append(orig_node)
dest_nodes = []
for des in dest_geo['geometry']:
    dest_xy = (des.y, des.x)
    dest_node = ox.get_nearest_node(graph, dest_xy)
    dest_nodes.append(dest_node)
# 最小パスの作成
route_lines = []
route_lengths=[]
for i in orig_nodes:
    for j in dest_nodes:
        if i==j: #出発点と到着点が同じ点に近似された場合は除外
            continue
        route = nx.shortest_path(G=graph, source=i, target=j, weight='length')
        route_nodes = nodes_proj.loc[route]
        route_line = LineString(list(route_nodes.geometry.values))
        route_lines.append(route_line)
        route_lengths.append(route_line.length)
route_geom = pd.DataFrame([route_lines, route_lengths]).T
route_geom.columns = ['geometry', 'route_dist']
route_geom = gpd.GeoDataFrame(route_geom,geometry='geometry', crs=edges_proj.crs)
# 最短距離と最長距離
mini = route_geom['route_dist'].min()
maxx = route_geom['route_dist'].max()
# ビジュアル化
fig, ax = plt.subplots(figsize=(12,8))
route_geom.plot(ax=ax, color='red')
edges_proj.plot(ax=ax, color='gray', alpha=0.5, linewidth=0.7)
fig.savefig('network.png')
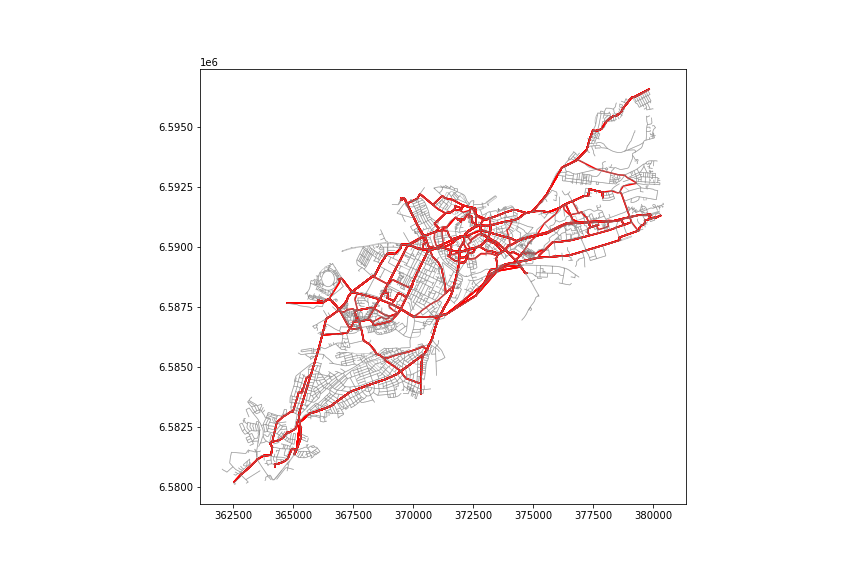
全てのルートを塗ると上図のようになります。ネットワーク解析については、GISで行うよりもPythonを使った方が様々なことが試せそうです。