1:はじめに
本記事ではCloudWatch AgentをWindows10へインストール & 起動し、CloudWatch LogsとWindowsイベントログを同期させてログ解析を行えるようにします。
Windows機へのAgentのインストール手順は数も多くなく、MS特有のハマりポイントも多く存在し、インストール & 起動にとても苦労しました。
2:概要
● 本記事の目的
WindowsPC(10)へCloudWatch Agentをインストールし、CloudWatch LogsにてWindowsイベントログの取得、及び解析を行う
● 本記事の流れ
① CloudWatch Agentのダウンロード、及びインストール
② 設定ファイルの作成、及び読み込み
③ Agantの起動
④ AWSコンソールよりログが取得できているか確認
● 機能要件
・Windows EventLogを取得する(System, Application)
・SSMは使用しない
3:CloudWatch Agentのインストール & 起動
3.1:Agnetのダウンロード、及びインストール
WindowsPCへCloudWatch Agentをダウンロードし、msiを起動しAgentをインストールします。
以下ダウンロードリンクをクリックし、msiをダウンロードします。
https://s3.amazonaws.com/amazoncloudwatch-agent/windows/amd64/latest/amazon-cloudwatch-agent.msi
ダウンロードした[amazon-cloudwatch-agent.msi]をダブルクリックし、Agentをインストールします。
※ウィザードは表示されません
以下パスを確認し、CloudWatchAgentディレクトリが作成されていることを確認します。
・C:\Program Files\Amazon\AmazonCloudWatchAgent
・C:\ProgramData\Amazon\AmazonCloudWatchAgent
3.2: 設定ファイルの作成、及び読み込み
ここからはPowershellにてCLI操作を行っていきます。
Powershellを管理者権限で起動し、カレントディレクトリをAmazonCloudWatchAgentディレクトリに移動します。
PS C:\> cd 'C:\Program Files\Amazon\AmazonCloudWatchAgent'
PS C:\Program Files\Amazon\AmazonCloudWatchAgent>
ディレクトリ内のexeファイルを起動し、ウィザード画面からAgentの設定ファイル(JSON)を作成します。
各パラメータを対話的に聞かれますので以下を参考に設定してください。
※各項目の詳細はページ下部、<おまけ1 <3.2 - 詳細>>を参照してください
PS C:\Program Files\Amazon\AmazonCloudWatchAgent>.\amazon-cloudwatch-agent-config-wizard.exe
=============================================================
= Welcome to the AWS CloudWatch Agent Configuration Manager =
=============================================================
On which OS are you planning to use the agent?
1. linux
2. windows
3. darwin
default choice: [2]:
2
Trying to fetch the default region based on ec2 metadata...
Are you using EC2 or On-Premises hosts?
1. EC2
2. On-Premises
default choice: [2]:
2
Please make sure the credentials and region set correctly on your hosts.
Refer to http://docs.aws.amazon.com/cli/latest/userguide/cli-chap-getting-started.html
Do you want to turn on StatsD daemon?
1. yes
2. no
default choice: [1]:
2
Do you have any existing CloudWatch Log Agent configuration file to import for migration?
1. yes
2. no
default choice: [2]:
2
Do you want to monitor any host metrics? e.g. CPU, memory, etc.
1. yes
2. no
default choice: [1]:
1
Do you want to monitor cpu metrics per core? Additional CloudWatch charges may apply.
1. yes
2. no
default choice: [1]:
1
Would you like to collect your metrics at high resolution (sub-minute resolution)? This enables sub-minute resolution for all metrics, but you can customize for specific metrics in the output json file.
1. 1s
2. 10s
3. 30s
4. 60s
default choice: [4]:
4
Which default metrics config do you want?
1. Basic
2. Standard
3. Advanced
4. None
default choice: [1]:
1
Current config as follows:
{
"metrics": {
"metrics_collected": {
"LogicalDisk": {
"measurement": [
"% Free Space"
],
"metrics_collection_interval": 60,
"resources": [
"*"
]
},
"Memory": {
"measurement": [
"% Committed Bytes In Use"
],
"metrics_collection_interval": 60
},
"Network Interface": {
"measurement": [
"Bytes Sent/sec",
"Bytes Received/sec",
"Packets Sent/sec",
"Packets Received/sec"
],
"metrics_collection_interval": 60,
"resources": [
"*"
]
},
"Paging File": {
"measurement": [
"% Usage"
],
"metrics_collection_interval": 60,
"resources": [
"*"
]
},
"PhysicalDisk": {
"measurement": [
"Disk Write Bytes/sec",
"Disk Read Bytes/sec",
"Disk Writes/sec",
"Disk Reads/sec"
],
"metrics_collection_interval": 60,
"resources": [
"*"
]
},
"Processor": {
"measurement": [
"% Processor Time"
],
"metrics_collection_interval": 60,
"resources": [
"*"
]
}
}
}
}
Are you satisfied with the above config? Note: it can be manually customized after the wizard completes to add additional items.
1. yes
2. no
default choice: [1]:
1
Do you want to monitor any customized log files?
1. yes
2. no
default choice: [1]:
2
Do you want to monitor any Windows event log?
1. yes
2. no
default choice: [1]:
1
Windows event log name:
default choice: [System]
System
Do you want to monitor VERBOSE level events for Windows event log System ?
1. yes
2. no
default choice: [1]:
1
Do you want to monitor INFORMATION level events for Windows event log System ?
1. yes
2. no
default choice: [1]:
1
Do you want to monitor WARNING level events for Windows event log System ?
1. yes
2. no
default choice: [1]:
1
Do you want to monitor ERROR level events for Windows event log System ?
1. yes
2. no
default choice: [1]:
1
Do you want to monitor CRITICAL level events for Windows event log System ?
1. yes
2. no
default choice: [1]:
1
Log group name:
default choice: [System]
chibi-DESKTOP-Q0QSAHL-log-groups
Log stream name:
default choice: [{hostname}]
{hostname}-System.log
In which format do you want to store windows event to CloudWatch Logs?
1. XML: XML format in Windows Event Viewer
2. Plain Text: Legacy CloudWatch Windows Agent (SSM Plugin) Format
default choice: [1]:
1
Do you want to specify any additional Windows event log to monitor?
1. yes
2. no
default choice: [1]:
1
Windows event log name:
default choice: [System]
Application
Do you want to monitor VERBOSE level events for Windows event log Application ?
1. yes
2. no
default choice: [1]:
1
Do you want to monitor INFORMATION level events for Windows event log Application ?
1. yes
2. no
default choice: [1]:
1
Do you want to monitor WARNING level events for Windows event log Application ?
1. yes
2. no
default choice: [1]:
1
Do you want to monitor ERROR level events for Windows event log Application ?
1. yes
2. no
default choice: [1]:
1
Do you want to monitor CRITICAL level events for Windows event log Application ?
1. yes
2. no
default choice: [1]:
1
Log group name:
default choice: [Application]
chibi-DESKTOP-xxxxxx-log-groups
Log stream name:
default choice: [{hostname}]
{hostname}-Application.log
In which format do you want to store windows event to CloudWatch Logs?
1. XML: XML format in Windows Event Viewer
2. Plain Text: Legacy CloudWatch Windows Agent (SSM Plugin) Format
default choice: [1]:
1
Do you want to specify any additional Windows event log to monitor?
1. yes
2. no
default choice: [1]:
2
Saved config file to config.json successfully.
Current config as follows:
{
"logs": {
"logs_collected": {
"windows_events": {
"collect_list": [
{
"event_format": "xml",
"event_levels": [
"VERBOSE",
"INFORMATION",
"WARNING",
"ERROR",
"CRITICAL"
],
"event_name": "System",
"log_group_name": "chibi-DESKTOP-xxxxxxx-log-groups",
"log_stream_name": "{hostname}-System.log"
},
{
"event_format": "xml",
"event_levels": [
"VERBOSE",
"INFORMATION",
"WARNING",
"ERROR",
"CRITICAL"
],
"event_name": "Application",
"log_group_name": "chibi-DESKTOP-xxxxxxx-log-groups",
"log_stream_name": "{hostname}-Application.log"
}
]
}
}
},
"metrics": {
"metrics_collected": {
"LogicalDisk": {
"measurement": [
"% Free Space"
],
"metrics_collection_interval": 60,
"resources": [
"*"
]
},
"Memory": {
"measurement": [
"% Committed Bytes In Use"
],
"metrics_collection_interval": 60
},
"Network Interface": {
"measurement": [
"Bytes Sent/sec",
"Bytes Received/sec",
"Packets Sent/sec",
"Packets Received/sec"
],
"metrics_collection_interval": 60,
"resources": [
"*"
]
},
"Paging File": {
"measurement": [
"% Usage"
],
"metrics_collection_interval": 60,
"resources": [
"*"
]
},
"PhysicalDisk": {
"measurement": [
"Disk Write Bytes/sec",
"Disk Read Bytes/sec",
"Disk Writes/sec",
"Disk Reads/sec"
],
"metrics_collection_interval": 60,
"resources": [
"*"
]
},
"Processor": {
"measurement": [
"% Processor Time"
],
"metrics_collection_interval": 60,
"resources": [
"*"
]
}
}
}
}
Please check the above content of the config.
The config file is also located at config.json.
Edit it manually if needed.
Do you want to store the config in the SSM parameter store?
1. yes
2. no
default choice: [1]:
2
Please press Enter to exit...
Program exits now.
上記にて設定ファイルの作成が完了しました。
以下パスに設定ファイルが作成されていることを確認してください。
C:\Program Files\Amazon\AmazonCloudWatchAgent\config.json
しかし、設定ファイルを作成しただけでは、CloudWatchでログの収集は行なえません。
作成した設定ファイルを読み込む必要があります。(ここがちょっとややこしいです。。)
まずは、新たにCloudWatchAgent用のCLIプロファイルを生成します。
以下パスのAWS CLIの設定ファイルをテキストエディタで開いてください。
C:\Users<端末にログオンしているユーザー名>.aws\config
C:\Users<端末にログオンしているユーザー名>.aws\credentials
以下を参考に設定ファイルを編集してください。
【.aws\config】
[default]
region = <リージョン名>
output = <テキスト形式>
↓ 修正
[default]
region = <リージョン名>
output = <テキスト形式>
[profile AmazonCloudWatchAgent]
region = <リージョン名>
output = <テキスト形式>
【.aws\credentials】
[default]
aws_access_key_id = <アクセスキーID>
aws_secret_access_key = <シークレットキーID>
↓ 修正
[default]
aws_access_key_id = <アクセスキーID>
aws_secret_access_key = <シークレットキーID>
region = <リージョン名>
[AmazonCloudWatchAgent]
aws_access_key_id = <アクセスキーID>
aws_secret_access_key = <シークレットキーID>
region = <リージョン名>
続いてCloudWatchAgentのエージェント設定を修正します。
デフォルトだと存在しないAdministoratorユーザーがカレントユーザになってしまうので、先程生成したCloudWatchAgentユーザが使用されるようにします。
以下パスの設定ファイルに書き込み権限を付与してください。
※1:対象ファイルを右クリック - [プロパティ] - 画面中央[編集]
※2:[Users]を選択し、メニュー下部で書き込み権限にチェックを入れる
C:\ProgramData\Amazon\AmazonCloudWatchAgent\common-config.toml
権限が付与できたら、テキストエディタで開いて以下を参考に中身を編集してください。
# This common-config is used to configure items used for both ssm and cloudwatch access


## Configuration for shared credential.
## Default credential strategy will be used if it is absent here:
## 	Instance role is used for EC2 case by default.
##	AmazonCloudWatchAgent profile is used for onPremise case by default.
# [credentials]
#    shared_credential_profile = "{profile_name}"
#    shared_credential_file = "{file_name}"


## Configuration for proxy.
## System-wide environment-variable will be read if it is absent here.
## i.e. HTTP_PROXY/http_proxy; HTTPS_PROXY/https_proxy; NO_PROXY/no_proxy
## Note: system-wide environment-variable is not accessible when using ssm run-command.
## Absent in both here and environment-variable means no proxy will be used.
# [proxy]
#    http_proxy = "{http_url}"
#    https_proxy = "{https_url}"
#    no_proxy = "{domain}"

# [ssl]
#    ca_bundle_path = "{ca_bundle_file_path}"
↓ 修正
# This common-config is used to configure items used for both ssm and cloudwatch access


## Configuration for shared credential.
## Default credential strategy will be used if it is absent here:
## 	Instance role is used for EC2 case by default.
##	AmazonCloudWatchAgent profile is used for onPremise case by default.
[credentials]
    shared_credential_profile = "AmazonCloudWatchAgent"
    shared_credential_file = "C:\\Users\\<端末にログオンしているユーザー名>\\.aws\\credentials"


## Configuration for proxy.
## System-wide environment-variable will be read if it is absent here.
## i.e. HTTP_PROXY/http_proxy; HTTPS_PROXY/https_proxy; NO_PROXY/no_proxy
## Note: system-wide environment-variable is not accessible when using ssm run-command.
## Absent in both here and environment-variable means no proxy will be used.
# [proxy]
#    http_proxy = "{http_url}"
#    https_proxy = "{https_url}"
#    no_proxy = "{domain}"

# [ssl]
#    ca_bundle_path = "{ca_bundle_file_path}"
続いてPowershellにて以下コマンドを実行し、以下のような結果が出力されることを確認してください。
PS C:\Program Files\Amazon\AmazonCloudWatchAgent> & "C:\Program Files\Amazon\AmazonCloudWatchAgent\amazon-cloudwatch-agent-ctl.ps1" -a fetch-config -m onPremise -s -c file:config.json
****** processing amazon-cloudwatch-agent ******
Got Home directory: C:\Users\Administrator
I! Set home dir windows: C:\Users\Administrator
I! SDKRegionWithCredsMap region:  ap-northeast-1
Successfully fetched the config and saved in C:\ProgramData\Amazon\AmazonCloudWatchAgent\Configs\file_config.json.tmp
Start configuration validation...
2021/09/14 21:36:21 Reading json config file path: C:\ProgramData\Amazon\AmazonCloudWatchAgent\Configs\file_config.json.tmp ...
Valid Json input schema.
Got Home directory: C:\Users\Administrator
I! Set home dir windows: C:\Users\Administrator
I! SDKRegionWithCredsMap region:  ap-northeast-1
No csm configuration found.
Under path : /logs/ | Info : Got hostname DESKTOP-xxxxxxx as log_stream_name
Configuration validation first phase succeeded
Configuration validation second phase succeeded
Configuration validation succeeded
AmazonCloudWatchAgent has been stopped
AmazonCloudWatchAgent has been started
4:動作確認
ここまでで、CloudWatchAgentの起動は完了しました。
動作確認として、インストールしたAgentが起動しているか、CloudWatch logsでWindowsのログを取得できているかを確認しましょう。
4.1 Windows(オンプレ)での単体確認
まずはWindows側での確認です。
ここではサービスマネージャでAgentサービスが起動しているか確認します。
サービスマネージャを起動します。
※1:[Windows] + [r]を押打
※2:と入力し、[OK]をクリック
サービス画面で[Amazon Cloudwatch agent]の状態が[実行中]であることを確認します。
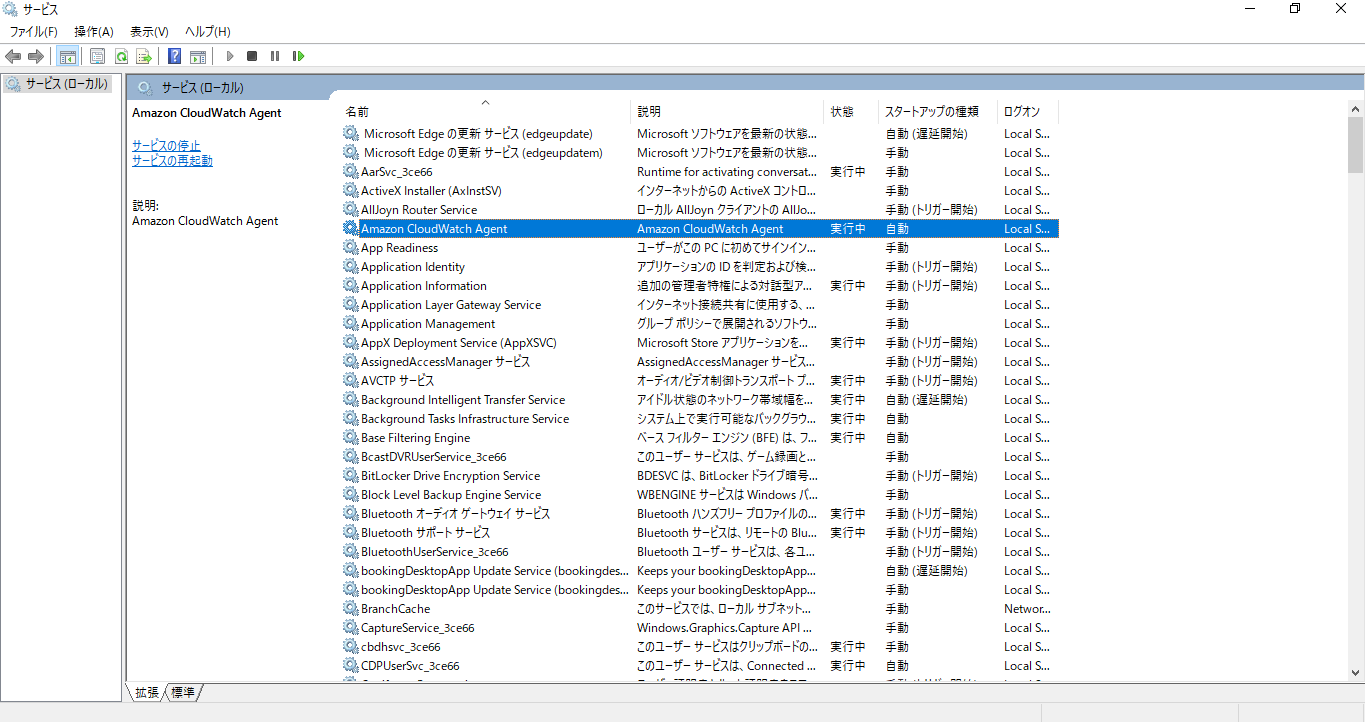
状態が[実行中]ではない場合はファイルの読み込みに失敗している可能性がありますので、再度ファイルの読み込みを行って下さい。
4.2 AWS(クラウド)での単体確認
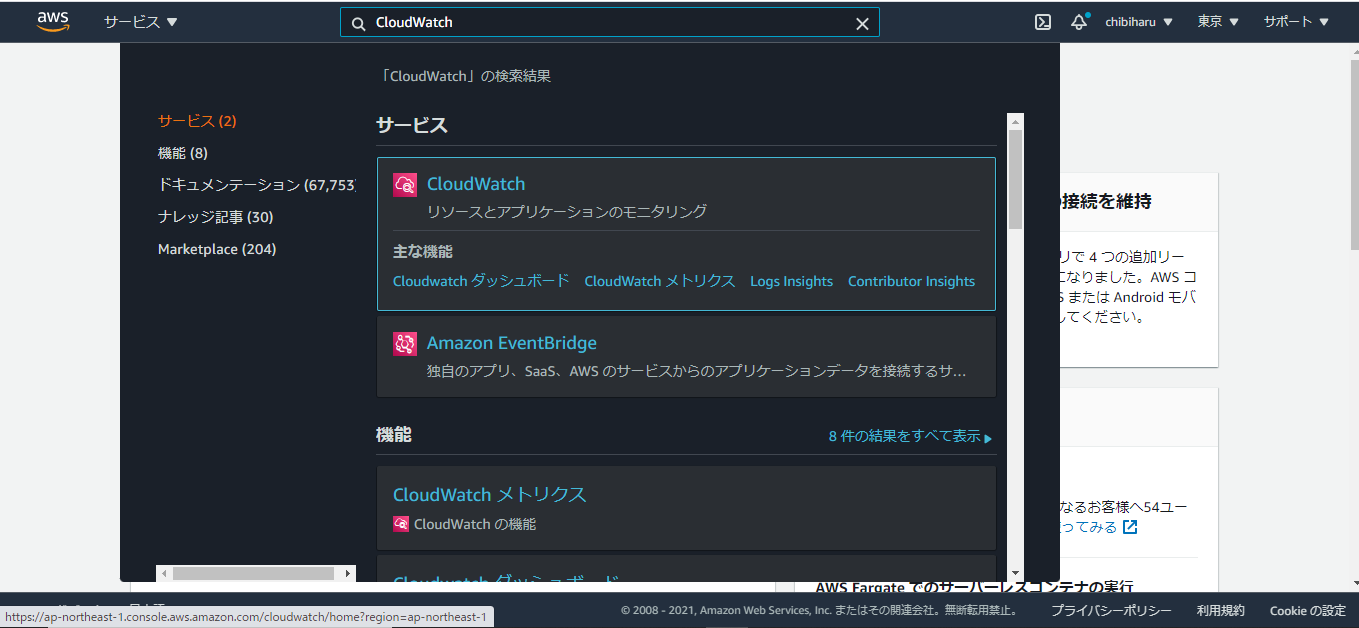
Windows側でAgentが起動中であることを確認できたので、続いてAWS側を確認します。
AWSマネジメントコンソールを開き、管理コンソール画面上部の検索バーでと検索をかけ、表示された[CloudWtahc]をクリックします。
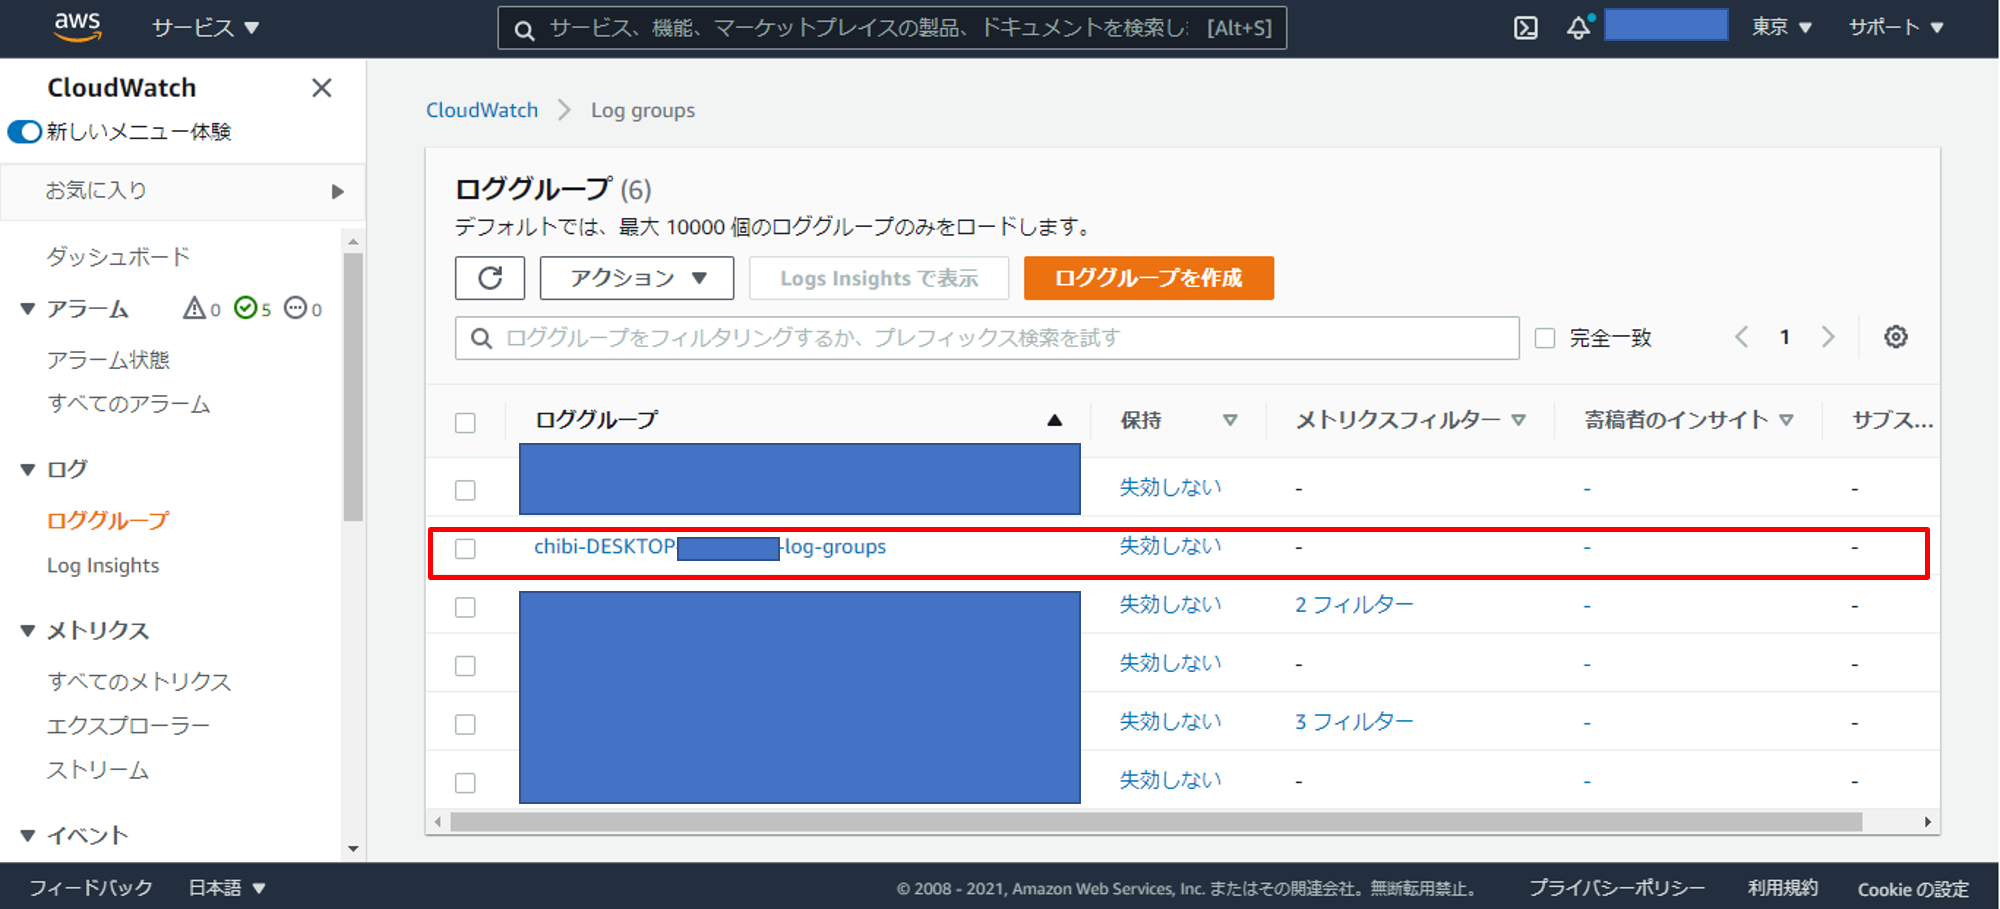
CloudWatch管理画面が表示されたことを確認し、ナビゲーションペイン、[ログ] - [ロググループ]をクリックします。
ロググループ一覧が表示されるので、ウィザードで生成したロググループ名が表示されたことを確認します。
ロググループをクリックし、ウィザードで生成したログストリームが生成されていることを確認します。
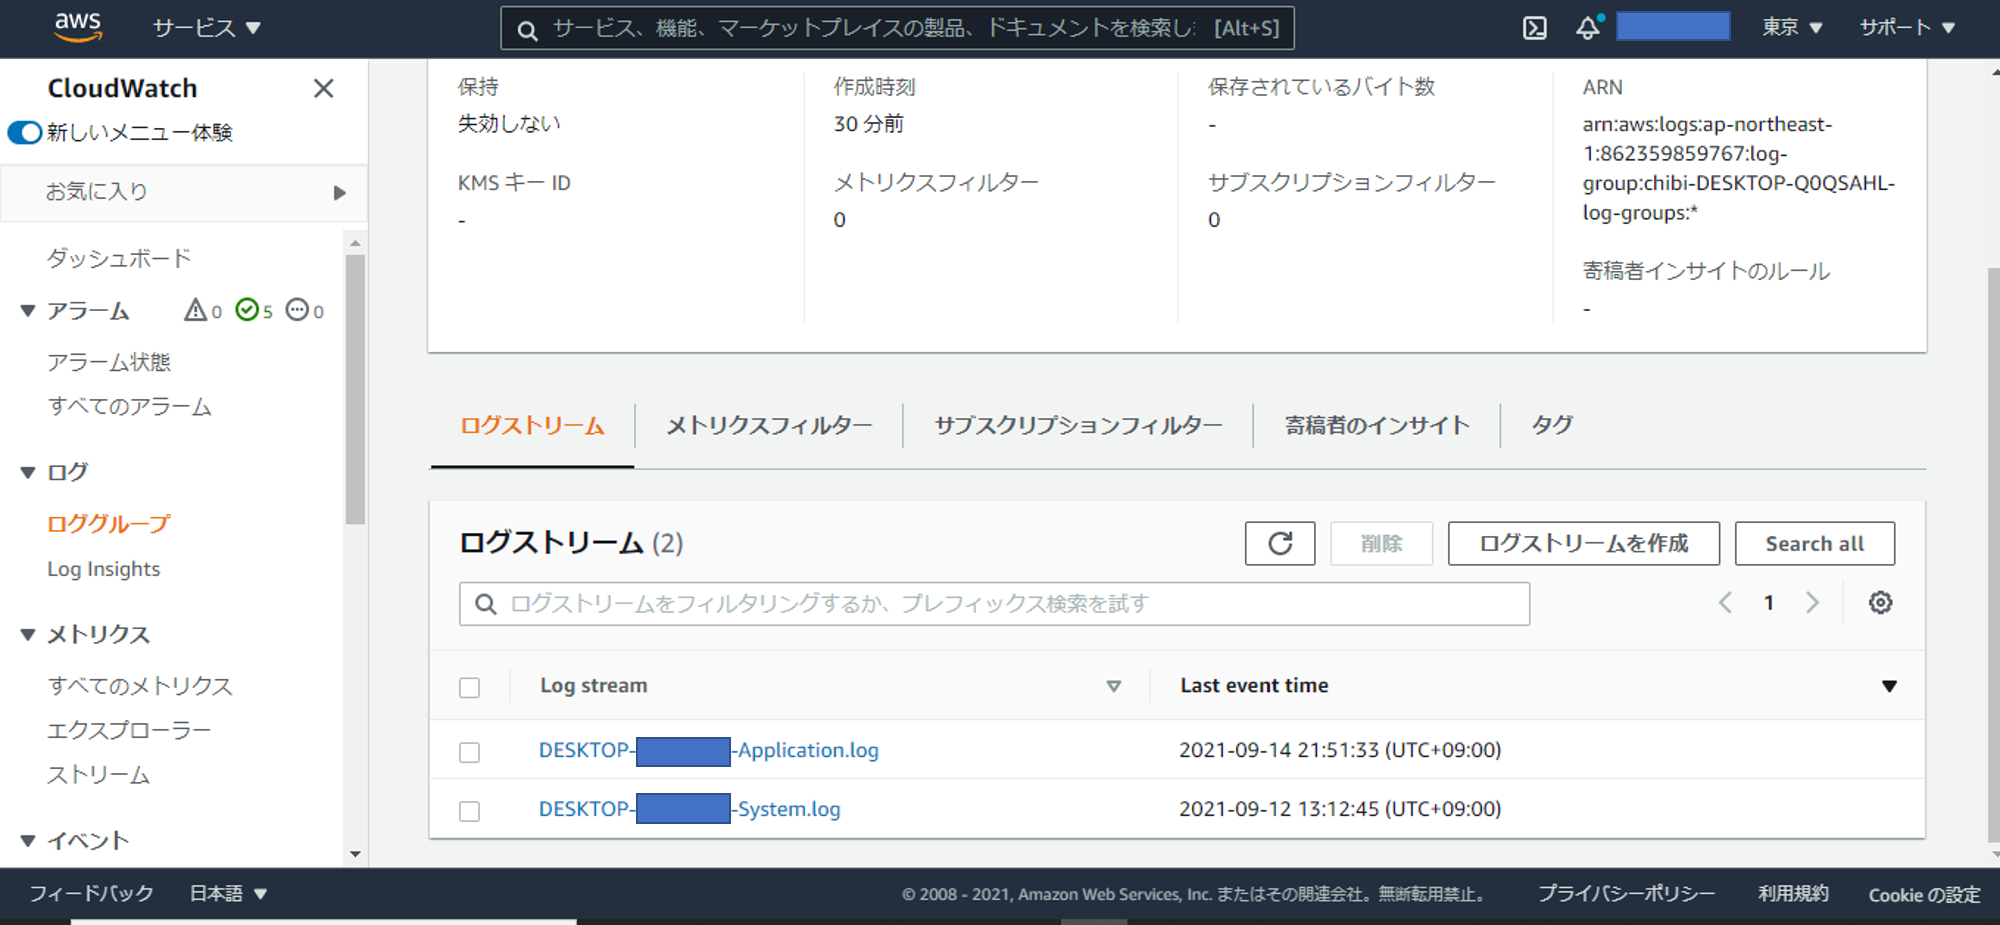
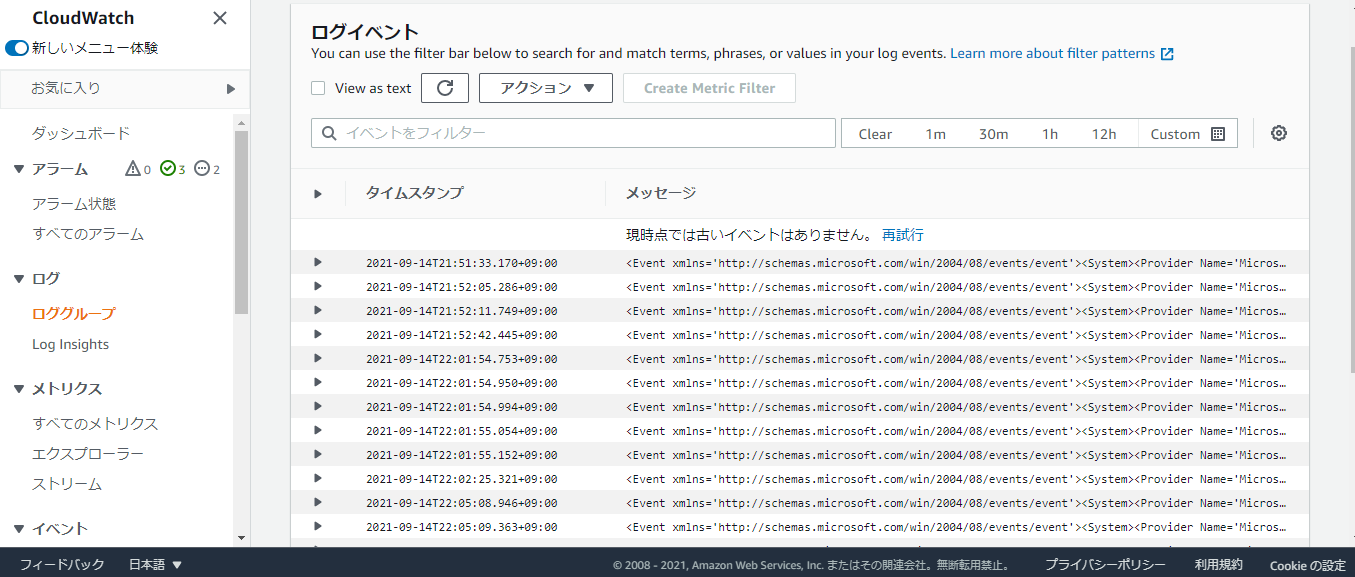
いづれかのログストリームをクリックし、Windowsのイベントログを収集できていることを確認します。
5:まとめ
以上がCloudWatch Agentのダウンロードから起動までの手順になります。
Linuxと違って設定ファイルの読み込みという工程がLinuxと比べてわかりづらさを助長していると感じています。。
今回はログの取得を目標に作業を行いましたが、もっと様々なこと、例えばパフォーマンス計測なんかもできますので是非そちらもトライしてみてください。
では、本記事は以上になります。ありがとうございました。
おまけ1 <3.2 - 詳細>
ここでは設定ファイル作成時のウィザードで聞かれる各項目の説明を紹介します。
Agentを起動する端末のOSを選択します。
今回はWindows10を使用するので[2]を選択します。
On which OS are you planning to use the agent?
1. linux
2. windows
3. darwin
default choice: [2]:
2
端末がEC2インスタンスなのかオンプレミスなのかを選択します。
言わずもがな[2]を選択します。
Trying to fetch the default region based on ec2 metadata...
Are you using EC2 or On-Premises hosts?
1. EC2
2. On-Premises
default choice: [2]:
2
StatsD プロトコルを使用するかを選択します。
StatsD プロトコルとは、様々なアプリケーション等からカスタムメトリクスを取得できるオープンソースソリューションです。
StatsD?なんだそれって思われた方やイマイチピンと来ていない方は[2]を選択してください。
StatsDについての詳細は以下公式ドキュメントを参照ください。
https://docs.aws.amazon.com/ja_jp/AmazonCloudWatch/latest/monitoring/CloudWatch-Agent-custom-metrics-statsd.html
Please make sure the credentials and region set correctly on your hosts.
Refer to http://docs.aws.amazon.com/cli/latest/userguide/cli-chap-getting-started.html
Do you want to turn on StatsD daemon?
1. yes
2. no
default choice: [1]:
2
既にAgentを起動していて引き続きたい設定ファイルがあるかを聞かれています。
特に見に覚えが無いようでしたら、[2]を選択してください。
Do you have any existing CloudWatch Log Agent configuration file to import for migration?
1. yes
2. no
default choice: [2]:
2
CPUやメモリの状態をモニタリングするのかを選択します。
今回は[1]を選択します。
Do you want to monitor any host metrics? e.g. CPU, memory, etc.
1. yes
2. no
default choice: [1]:
1
コア毎..つまりは詳細にメトリクスを取得するのか聞かれています。
今回は[1]を選択します。
※[1]を選ぶと追加課金が発生する場合があるので要注意
Do you want to monitor cpu metrics per core? Additional CloudWatch charges may apply.
1. yes
2. no
default choice: [1]:
1
何分毎にメトリクスを取得するのかを選択します。
今回は[4]を選択します。
Would you like to collect your metrics at high resolution (sub-minute resolution)? This enables sub-minute resolution for all metrics, but you can customize for specific metrics in the output json file.
1. 1s
2. 10s
3. 30s
4. 60s
default choice: [4]:
4
メトリクス設定を選択します。
個人利用でしたら[1]のbasicで十分です。
Which default metrics config do you want?
1. Basic
2. Standard
3. Advanced
4. None
default choice: [1]:
1
基本の設定ファイルの中身が出力されます。
記載内容に問題がなければ[1]を選択します。
Current config as follows:
{
        "metrics": {
                "metrics_collected": {
~~~ 以下略 ~~~
                }
        }
}
Are you satisfied with the above config? Note: it can be manually customized after the wizard completes to add additional items.
1. yes
2. no
default choice: [1]:
1
任意のログを取得するかを設定します。
ここで指定するログにイベントログは含まれませんので、今回は[2]を選択します。
Do you want to monitor any customized log files?
1. yes
2. no
default choice: [1]:
2
イベントログを取得するかを選択します。
[1]を選択します。
Do you want to monitor any Windows event log?
1. yes
2. no
default choice: [1]:
1
どのイベントログを取得するのか指定します、
デフォルトではSystemログが選択されます。
Windows event log name:
default choice: [System]
System
取得するエラーレベルを指定します。
今回は[VERBOSE/INFORMATION/WARNING/ERROR/CRITICAL]全て取得するので、全ての質問に[1]を選択します。
Do you want to monitor VERBOSE level events for Windows event log System ?
1. yes
2. no
default choice: [1]:
1
ロググループ名とログストリーム名を指定します。
ロググループ名は端末が分かる名前、ログストリーム名はログの種類なんかを記載してあげると後々分かりやすくなるのでオススメです。
Log group name:
default choice: [System]
chibi-DESKTOP-Q0QSAHL-log-groups
Log stream name:
default choice: [{hostname}]
{hostname}-System.log
ログの出力形式をxmlかプレーンテキストかを選択します。
xml形式の方が分かりやすくてオススメです。
In which format do you want to store windows event to CloudWatch Logs?
1. XML: XML format in Windows Event Viewer
2. Plain Text: Legacy CloudWatch Windows Agent (SSM Plugin) Format
default choice: [1]:
1
他のイベントログも追加で取得するかを選択します。
他のApplicationログ等も一緒に取得したい場合は[1]で追加分を設定してください
Do you want to specify any additional Windows event log to monitor?
1. yes
2. no
default choice: [1]:
2
設定ファイルが出力されますので、各パラメータに問題がなければ[2]を選択してください。
修正したい箇所を見つけた際は[1]を選択して再設定を行って下さい。
Saved config file to config.json successfully.
Current config as follows:
{
        "logs": {
                "logs_collected": {

~~~ 以下略 ~~~

        }
}
Please check the above content of the config.
The config file is also located at config.json.
Edit it manually if needed.
Do you want to store the config in the SSM parameter store?
1. yes
2. no
default choice: [1]:
2
「Enter」をクリックし、設定ファイルの作成を完了します。
Please press Enter to exit...

Program exits now.
以上で設定ファイルの作成が完了になります。
ウィザードからでは色々と聞かれて面倒かとは思います。
後で設定ファイル自体を直接修正をかけることも可能ですので、無理にウィザード画面での設定に拘る必要もありません。