1.Meanshiftによるclustering
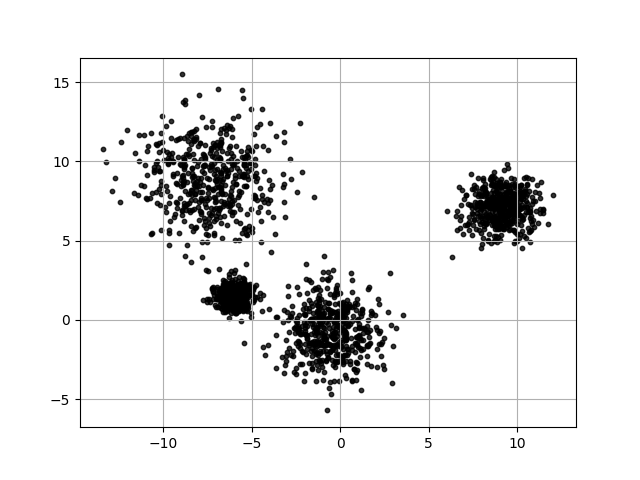
先に、Sklearn.cluster.MeanShiftを利用して、あるデータをクラスタリングしてみます。データ生成するにはSklearnのdatasets.make_blobsを使用しました。生成されるサンプル数を2000にして、クラス数を4、サンプルごとの特徴数を2、cluster_stdをそれぞれ0.5, 1.0, 1.5, 2.0にしました。
こちらは生成されたデータです
import numpy as np
import matplotlib.pyplot as plt
from sklearn.cluster import MeanShift
from sklearn.cluster import estimate_bandwidth
from sklearn import datasets

#データを作る
x,y = datasets.make_blobs(n_samples=2000, centers=4,
                           n_features=2,
                           cluster_std = [0.5, 1.0, 1.5, 2.0])
plt.scatter(x[:,0],x[:,1],s = 10,
            alpha = 0.8,c='k')
plt.grid()

#bandwidthを計算する
bandwidth = estimate_bandwidth(x, quantile=0.2,
                              n_samples=5000)
print(bandwidth)

#Meanshiftをフィットする
ms = MeanShift(bandwidth = bandwidth,
               bin_seeding = True)
ms.fit(x)
labels = ms.fit_predict(x)

#結果
plt.figure()
plt.scatter(x[:,0], x[:,1], c = labels)
plt.axis('equal')
plt.title('meanshift prediction')
plt.show()

print(bandwidth)
結果

bandwidth は 2.9507367943444662
2.Meanshiftの原理について
Meanshiftは、カーネル密度推定(kernel density estimation)を用いたデータ解析手法です。イメージセグメンテーション、画像平滑化などに応用されていました。
Meanshiftの流れ
| 記法 | 意味 |
|---|---|
| $R^d$ | d次元空間 |
| $x_i$ | サンプル点 |
| $i$ | $i=1,2,...n$ |
| $M_h(x)$ | サンプル点$x$に対するMeanshiftベクター |
| $k$ | サンプル点$x$が含まれる円状区域の点数 |
| $h$ | サンプル点$x$が含まれる円状区域の半径 |
| $S_h(x)$ | サンプル点$x$が含まれる円状区域 |
$R^d$内に$n$個のサンプル点 $x_i$ があり、その中の1つの点 $x$ に対するMeanshiftベクターの基本形式は以下のようになります。
$$M_h(x)=1/k \sum_{x_i∈S_h(x)}^k (x_i-x) $$
$S_h(x)$ は半径は $h$ である円状区域で、円の中心点は $x$ であり、中に $k$ 個のサンプル点が含まれています。この円の中心点とすべての $k$ 個の点のベクター和はMeanshiftになります。下の図で黄色の矢印でMeanshiftを示します。青い円状区域は $S_h(x)$ 、中心点は $x$ です。

Meanshiftの流れは:
- 現在の $S_h(x)$ で中心点と $x$ のベクター和を計算する($S_h(x)$ の重心を計算する)
- 中心点 $x$ はその重心まで移動する
- 移動量が十分に小さくなれば、最初に戻る
Meanshiftはiterativeです。特定のサンプル点のある区域の重心を計算し、それに移動します。移動量が十分に小さいくなれば最初に戻ります。下の図では、青い円状区域は計算される区域で、windowとも呼ばれます。

そして、反復プロせうの終了条件を満たす場合、すべてのwindowがある点で集合すれば、一集合になり、clusteringされます。以下の図のようです。

下の図でmeanshiftアルゴリズムによるclusteringを表現できます。

3.Meanshiftによるイメージセグメンテーションの実装
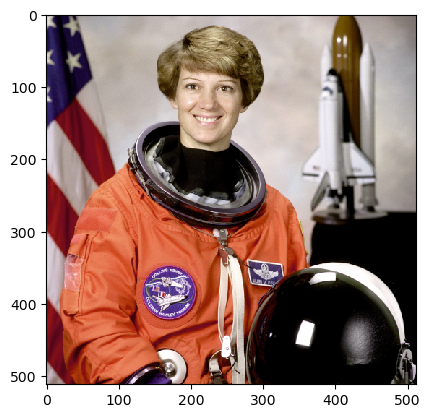
Meanshiftアルゴリズムによるイメージセグメンテーションを体験してみました。Sklearnにじっそうされているmeanshiftとbandwidthを計算できるestimate_bandwidthを利用しました。注意すべきことはestimate_bandwidthのn_samplesです。n_samplesとは、ランダムにn個のサンプルを選択してbandwidthを計算するハイパーパラメータのことで、大きくすれば計算量が非常に大きくなります。ディフォルトはNone, すべてのデータで計算することです。
元画像

import matplotlib.pyplot as plt
image = plt.imread('icon.jpg')
plt.figure(dpi=150)
plt.title('original image')
plt.imshow(image)

from sklearn.cluster import MeanShift
from sklearn.cluster import estimate_bandwidth
import numpy as np
from pylab import *

bandwidth1 = estimate_bandwidth(image,
                                quantile = 0.2,
                                n_samples = 1000 )

meanshift = MeanShift(bandwidth = bandwidth1,
                      bin_seeding = True,
                      n_jobs = -1,
                      cluster_all = True)

meanshift.fit(img)

label = meanshift.labels_

label = label.reshape(720,1280)

imshow(label)
結果
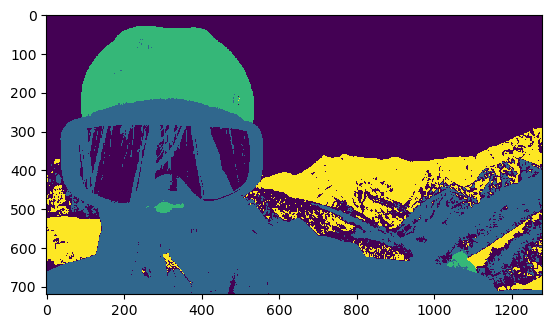
skimageのastronaut画像にmeanshiftを試しました。上の結果は、n_samplesを1000にしたので、estimate_bandwidthは数分間で終わりました。今回、n_samplesをディフォルト、すなわち、すべてのデータを計算に使いました。計算時間は大体3時間でした。
元画像
結果
