はじめに
今回紹介するのは、Lindenmayer system (L-system)という形式文法の一種で植物の成長や細胞分裂のモデルなどに使われているアルゴリズムです。
シェルピンスキーの三角形や

このような樹木のモデルをL-systemによって記述することができます。(図はWikipediaより引用)

今回はalgae(藻)のL-systemによって記述される生成過程をNetworkxとMatplotlibを用いてgif画像にすることによって観察してみましょう。
先走ってお見せをするとこんな感じです。

L-systemとは
Lindenmayer system (L-system)は
$L=(\Sigma,P,\omega)$によって定義されます。
($\Sigma:$状態の集合、$P:$書き換え規則、$\omega:$初期文字列)
これだけ言われても何のこっちゃということなので実例を見ていきましょう。
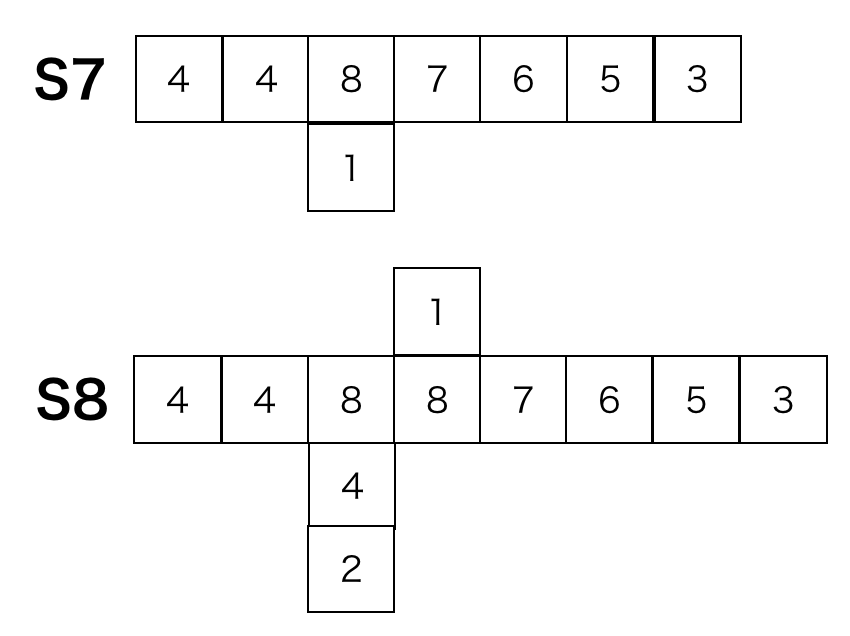
今回の対象のalgaeは以下のように成長していきます。数字は、細胞の種類を表しています(今回は8種類)
成長の規則を考えてみてください。


各時刻のalgaeを文字列によって表します。枝分かれは()を使って表します。
S1 1
S2 42
S3 443
S4 4453
S5 44653
S6 447653
S7 448(1)7653
S8 448(42)8(1)7653
規則が見えてきましたか?
今回の規則は
$1 \to 42,2\to43,3\to53,4\to4,5\to6,6\to7,7\to8(1),8\to8$
です。これが書き換え規則$P$に相当します。
お分かりかとは思いますが、$\omega:1$, $\Sigma:$ {$1,2,3,4,5,6,7,8$}です。
実装
では実装していきましょう。
まずは、文字列をtextファイルに書き出すスクリプトです。
import sys

def update(old_cell,production):
    new_cell = ''

    for i in range(len(old_cell)):
        new_cell += production[old_cell[i]]

    new_cell = new_cell.replace(",", "", -1)

    return new_cell


def main(argv):

    production = {'1':'4,2','2':'4,3','3':'5,3','4':'4',
                  '5':'6','6':'7','7':'8(1)','8':'8','(':'(',')':')'}

    char = {}
    char[1] = '1'
    count = {}
    num_stage = int(argv)

    for i in range(2,num_stage+1):
        char[i] = update(char[i-1],production)

    with open('char.txt', 'w') as f:
        for i in range(1,num_stage+1):
            print(i,char[i],file=f)
    f.close()


if __name__ == '__main__':
    main(sys.argv[1])
python駆け出しの方にとっては程よい練習問題ではないでしょうか。
ステージ20まで回した結果が以下になります。
1 1
2 42
3 443
4 4453
5 44653
6 447653
7 448(1)7653
8 448(42)8(1)7653
9 448(443)8(42)8(1)7653
10 448(4453)8(443)8(42)8(1)7653
11 448(44653)8(4453)8(443)8(42)8(1)7653
12 448(447653)8(44653)8(4453)8(443)8(42)8(1)7653
13 448(448(1)7653)8(447653)8(44653)8(4453)8(443)8(42)8(1)7653
14 448(448(42)8(1)7653)8(448(1)7653)8(447653)8(44653)8(4453)8(443)8(42)8(1)7653
15 448(448(443)8(42)8(1)7653)8(448(42)8(1)7653)8(448(1)7653)8(447653)8(44653)8(4453)8(443)8(42)8(1)7653
16 448(448(4453)8(443)8(42)8(1)7653)8(448(443)8(42)8(1)7653)8(448(42)8(1)7653)8(448(1)7653)8(447653)8(44653)8(4453)8(443)8(42)8(1)7653
17 448(448(44653)8(4453)8(443)8(42)8(1)7653)8(448(4453)8(443)8(42)8(1)7653)8(448(443)8(42)8(1)7653)8(448(42)8(1)7653)8(448(1)7653)8(447653)8(44653)8(4453)8(443)8(42)8(1)7653
18 448(448(447653)8(44653)8(4453)8(443)8(42)8(1)7653)8(448(44653)8(4453)8(443)8(42)8(1)7653)8(448(4453)8(443)8(42)8(1)7653)8(448(443)8(42)8(1)7653)8(448(42)8(1)7653)8(448(1)7653)8(447653)8(44653)8(4453)8(443)8(42)8(1)7653
19 448(448(448(1)7653)8(447653)8(44653)8(4453)8(443)8(42)8(1)7653)8(448(447653)8(44653)8(4453)8(443)8(42)8(1)7653)8(448(44653)8(4453)8(443)8(42)8(1)7653)8(448(4453)8(443)8(42)8(1)7653)8(448(443)8(42)8(1)7653)8(448(42)8(1)7653)8(448(1)7653)8(447653)8(44653)8(4453)8(443)8(42)8(1)7653
20 448(448(448(42)8(1)7653)8(448(1)7653)8(447653)8(44653)8(4453)8(443)8(42)8(1)7653)8(448(448(1)7653)8(447653)8(44653)8(4453)8(443)8(42)8(1)7653)8(448(447653)8(44653)8(4453)8(443)8(42)8(1)7653)8(448(44653)8(4453)8(443)8(42)8(1)7653)8(448(4453)8(443)8(42)8(1)7653)8(448(443)8(42)8(1)7653)8(448(42)8(1)7653)8(448(1)7653)8(447653)8(44653)8(4453)8(443)8(42)8(1)7653
では、いよいよNetworkxとMatplotlibを用いてアニメーションにしていきます。
Matplotlibでアニメーションを作る部分に関してはこちらを参照ください。
matplotlibのanimation.FuncAnimationを用いて柔軟にアニメーション作成
なるべく枝分かれがバラバラになって欲しかったので、グラフの直線で繋がっている部分を1つの成分と見なし、1つの成分から枝分かれするときの方向は偶奇で180度異なるようにしています。(branchという辞書で成分毎の枝分かれを管理しています)
import networkx as nx
import matplotlib.pyplot as plt
import sys
import numpy as np
import matplotlib.animation as anm

def movie_update(i, graph_dic, xmin, xmax, ymin, ymax, color, num_stage):
    # 現在描写されているグラフを消去
    if i != 0:
        plt.cla()

    if i == 0:
        return

    G = graph_dic[i]

    plt.subplot2grid((4,4), (0,0),colspan=3,rowspan=4)
    pos = {i:np.array(G.node[i]['pos']) for i in G.nodes()}
    nx.draw_networkx_edges(G, pos, width=1)
    node_color = [color[G.node[i]['label']] for i in G.nodes()]
    nx.draw_networkx_nodes(G, pos, node_size=50,node_color=node_color)
    # node番号を描画
    # for k in G.nodes():
    #     plt.text(pos[k][0],pos[k][1],k)
    # nodeのラベルを描画
    # node_labels = nx.get_node_attributes(G, 'label')
    # nx.draw_networkx_labels(G, pos,labels=node_labels,font_size=10, alpha=1, font_color="black")
    plt.xlim([xmin,xmax])
    plt.ylim([ymin,ymax])

    plt.title(f'stage{i}')

    plt.subplot2grid((4,4), (0,3),rowspan=2)
    for k in color:
        plt.plot(0,k,'o',alpha =1,color=color[k],label=f'{k}')
    for k in color:
        plt.text(0.01,k,k)
    plt.ylim([-0.5,8.2])
    plt.ylim(plt.ylim()[::-1])
    # plt.legend()
    plt.title('example')
    flush_progress_bar('movie',i/num_stage)


def flush_progress_bar(barname, rate):
    number = int(rate*20) + 1
    bar = ('#' * number).ljust(20, '-')
    sys.stdout.write(f"\r{barname} : [{bar}] {rate*100:.2f}%")


def update(old_cell,production):
    new_cell = ''

    for i in range(len(old_cell)):
        new_cell += production[old_cell[i]]

    new_cell = new_cell.replace(",", "", -1)

    return new_cell


def main(argv):

    change = {'1':'4','2':'4','3':'5','4':'4',
              '5':'6','6':'7','7':'8','8':'8'}
    growth = {'1':'2','2':'3','3':'3'}
    division = {'7':'1'}
    #7のみ枝分かれをして増殖

    G = nx.DiGraph()
    count = {}
    count[1] = 1
    G.add_node(count[1], label='1', pos=[0,0], direct=[1,0], component=0)
    num_stage = int(argv)
    graph_dic = {}
    graph_dic[1] = G.copy()

    color = {'1':'red','2':'coral','3':'orange','4':'gold',
             '5':'lawngreen','6':'mediumspringgreen','7':'cornflowerblue','8':'lightblue'}

    direction = 1
    quarter = 1
    branch = {0: 0}

    fig = plt.figure(figsize=(12,9))

    for i in range(2,num_stage+1):
        for j in range(1,count[i-1]+1):
            if G.node[j]['label'] in growth:
                flag = len(G.nodes())+1
                G.add_node(flag, label=growth[G.node[j]['label']], direct=G.node[j]['direct'], component=G.node[j]['component'])
                G.node[flag]['pos'] = [G.node[j]['pos'][k]+G.node[j]['direct'][k] for k in range(2)]
                G.add_edge(j,flag)

            if G.node[j]['label'] in division:
                flag = len(G.nodes())+1
                #元々x軸方向に動いていたもの
                if G.node[j]['direct'][0] != 0:
                    #この成分の中で何回目の枝分かれか
                    if branch[G.node[j]['component']] % 2 == 0:
                        G.add_node(flag, label=division[G.node[j]['label']], component=len(branch))
                        G.node[flag]['direct'] = [0,1]
                        G.node[flag]['pos'] = [G.node[j]['pos'][k]+G.node[flag]['direct'][k] for k in range(2)]
                    else:
                        G.add_node(flag, label=division[G.node[j]['label']], component=len(branch))
                        G.node[flag]['direct'] = [0,-1]
                        G.node[flag]['pos'] = [G.node[j]['pos'][k]+G.node[flag]['direct'][k] for k in range(2)]
                #元々y軸方向に動いていたもの
                else:
                    #この成分の中で何回目の枝分かれか
                    if branch[G.node[j]['component']] % 2 == 0:
                        G.add_node(flag, label=division[G.node[j]['label']], component=len(branch))
                        G.node[flag]['direct'] = [-1,0]
                        G.node[flag]['pos'] = [G.node[j]['pos'][k]+G.node[flag]['direct'][k] for k in range(2)]
                    else:
                        G.add_node(flag, label=division[G.node[j]['label']], component=len(branch))
                        G.node[flag]['direct'] = [1,0]
                        G.node[flag]['pos'] = [G.node[j]['pos'][k]+G.node[flag]['direct'][k] for k in range(2)]
                G.add_edge(j,flag)

                branch[G.node[j]['component']] += 1
                branch[G.node[flag]['component']] = 0


            G.node[j]['label'] = change[G.node[j]['label']]
        graph_dic[i] = G.copy()

        count[i] = len(G.node())
        flush_progress_bar('production',(i-1)/(num_stage-1))
    print()

    xmin = 0
    xmax = 0
    ymin = 0
    ymax = 0
    for i in G.nodes():
        if G.node[i]['pos'][0] < xmin:
            xmin = G.node[i]['pos'][0]
        elif G.node[i]['pos'][0] > xmax:
            xmax = G.node[i]['pos'][0]
        if G.node[i]['pos'][1] < ymin:
            ymin = G.node[i]['pos'][1]
        elif G.node[i]['pos'][1] > ymax:
            ymax = G.node[i]['pos'][1]

    xmin -= 1
    xmax += 1
    ymin -= 1
    ymax += 1

    frame = num_stage+1

    ani = anm.FuncAnimation(fig, movie_update, fargs = (graph_dic,xmin, xmax, ymin, ymax, color, num_stage), interval = 500, frames = frame)
    # ani.save(f"algae_{num_stage}.mp4", writer = 'ffmpeg')
    ani.save(f"algae_{num_stage}.gif", writer = 'imagemagick')


if __name__ == '__main__':
    main(sys.argv[1])
20ステージまで回して見た出力結果です。細胞の状態を表すラベルはコメントアウトしています。

。。。カオスですね。
3次元的にうまく配置をすればステージが増えても観察できそうですね。
長々と読んで頂いてありがとうございました。
