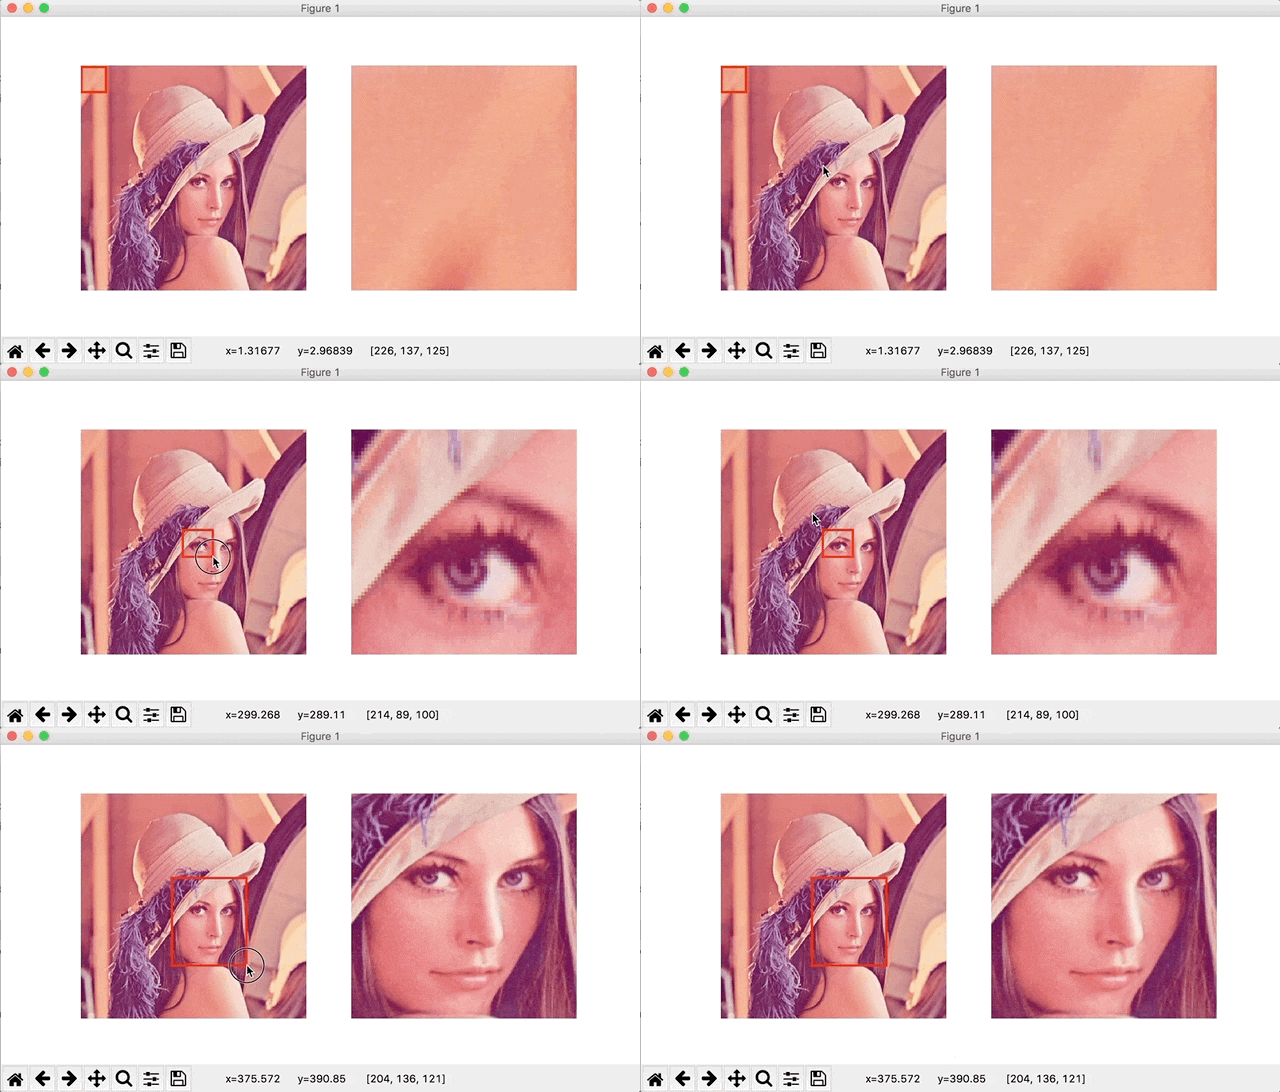
目的
matplotlibだけで画像からマウスで指定した領域を抜き出したい
結果
ソースコード
import numpy as np
import matplotlib.pyplot as plt

# 押した時
def Press(event):
    global x1,y1,DragFlag
    # 値がNoneなら終了
    if (event.xdata is None) or (event.ydata is None):
        return

    # 丸める
    cx = int(round(event.xdata))
    cy = int(round(event.ydata))

    x1 = cx
    y1 = cy

    # フラグをたてる
    DragFlag = True

# ドラッグした時
def Drag(event):
    global x1,y1,x2,y2,DragFlag

    # ドラッグしていなければ終了
    if DragFlag == False:
        return

    # 値がNoneなら終了
    if (event.xdata is None) or (event.ydata is None):
        return

    # 丸める
    cx = int(round(event.xdata))
    cy = int(round(event.ydata))

    x2 = cx
    y2 = cy

    # ソート
    ix1, ix2 = sorted([x1,x2])
    iy1, iy2 = sorted([y1,y2])

    # 画像の一部を抜き出す
    cimg = img[iy1:iy2,ix1:ix2,:]

    # 画像を更新
    im2.set_data(cimg)

    # 四角形を更新
    DrawRect(x1,x2,y1,y2)

    # 描画
    plt.draw()

# 離した時
def Release(event):
    global DragFlag
    # フラグをたおす
    DragFlag = False

# 四角形を描く関数
def DrawRect(x1,x2,y1,y2):
    Rect = [ [ [x1,x2], [y1,y1] ],
             [ [x2,x2], [y1,y2] ],
             [ [x1,x2], [y2,y2] ],
             [ [x1,x1], [y1,y2] ] ]
    for i, rect in enumerate(Rect):
        lns[i].set_data(rect[0],rect[1])

# 画像を開く
from PIL import Image
fnm = 'lena.tif'
img = Image.open(fnm)

# numpy.ndarrayに
img = np.asarray(img)

# 初期値
x1  = 0
y1  = 0
x2  = 50
y2  = 50

# ドラッグしているかのフラグ
DragFlag = False

# ソート
ix1, ix2 = sorted([x1,x2])
iy1, iy2 = sorted([y1,y2])

# 画像の一部を抜き出す
cimg = img[iy1:iy2,ix1:ix2,:]

# plot
plt.close('all')
plt.figure(figsize=(8,4))

# subplot 1
plt.subplot(1,2,1)

# 画像を描画
im1 = plt.imshow(img, cmap='gray')

# 四角形を描画
Rect = [ [ [x1,x2], [y1,y1] ],
         [ [x2,x2], [y1,y2] ],
         [ [x1,x2], [y2,y2] ],
         [ [x1,x1], [y1,y2] ] ]

lns = []
for rect in Rect:
    ln, = plt.plot(rect[0],rect[1],color='r',lw=2)
    lns.append(ln)

# 軸を消す
plt.axis('off')

# subplot 2
plt.subplot(1,2,2)
im2 = plt.imshow(cimg, cmap='gray')

# カラーマップの範囲を合わせる
plt.clim(im1.get_clim())

# 軸を消す
plt.axis('off')

# イベント
plt.connect('button_press_event', Press)
plt.connect('motion_notify_event', Drag)
plt.connect('button_release_event', Release)

plt.show()
動作確認
[mac]
Python 3.6.2
matplotlib 2.0.2
backend : MacOSX and Qt5Agg
[win7]
Python 3.6.3
matplotlib 2.1.0
backend : Qt5Agg
