内容
・matplotlibのfigure(図)、axes(軸)、lines(線)の階層構造を知ると幸せになれる
・gcaとgcfも知っておくと便利
・言葉の使い方が正確かは怪しい、実際の実装がどうなっているかも分かりません。誰か教えて下さい。
階層構造
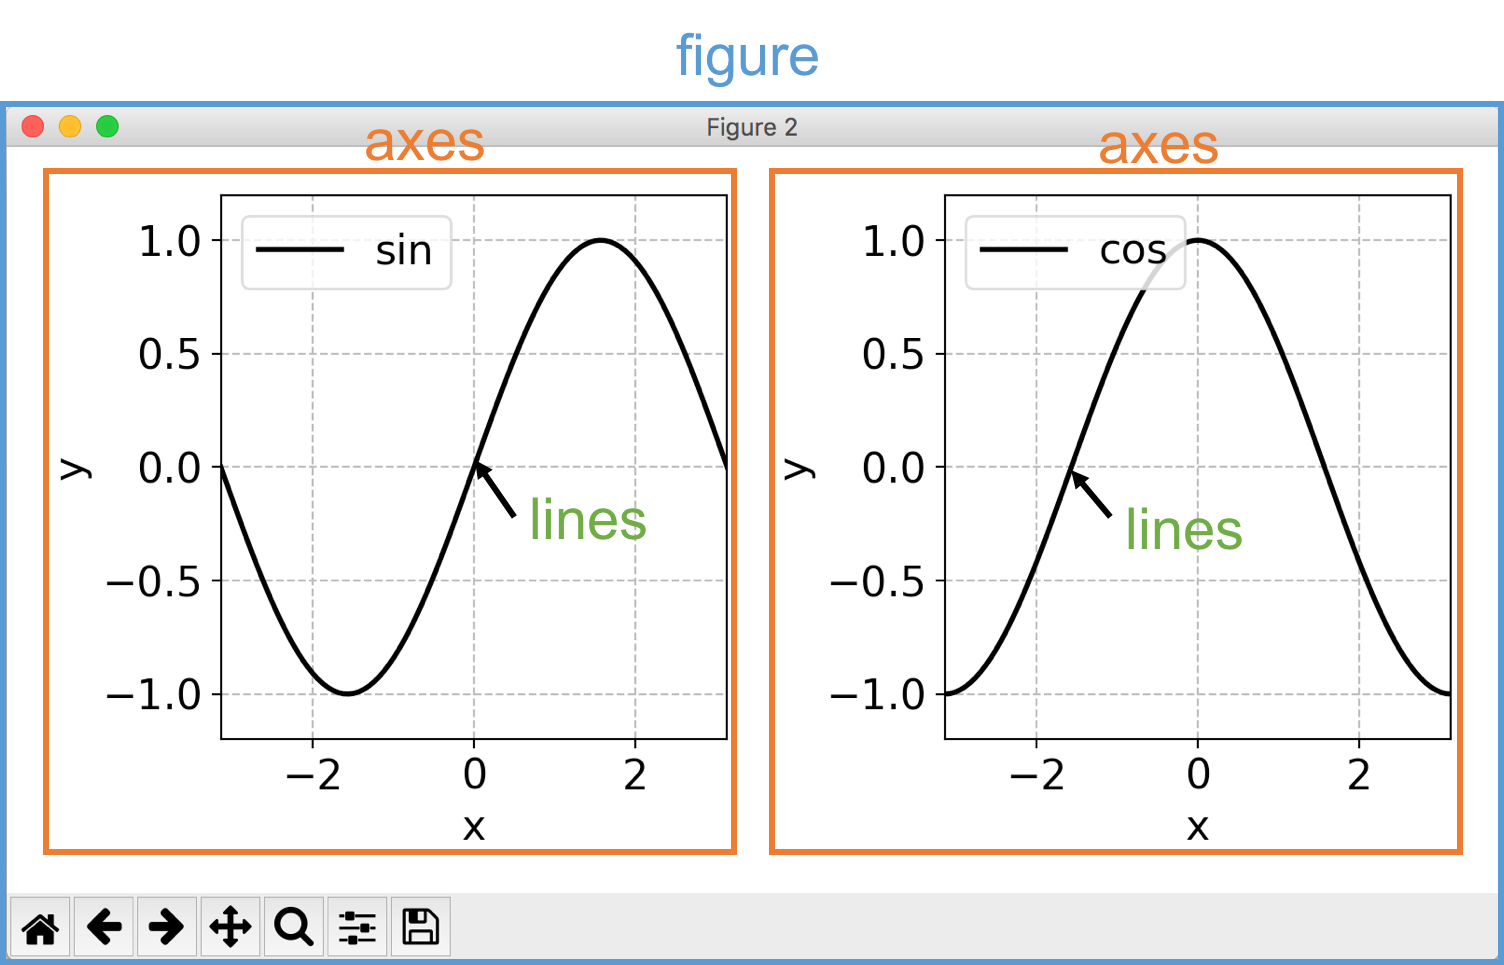
matplotlibは上図のような階層構造を持っている。figureの中にaxesがあり、axesの中にlinesがある。またxやyの値は、linesが持っている。
gca, gcf
直前に操作したfigureは、現在の図 (current figure)となり、直前に操作したaxesは、現在の軸(current axes)となる。現在のfigureはgcf(get current figureの略?)で取得でき、現在のaxesはgca(get current axesの略?)で取得できる。
gca = plt.gca()
gcf = plt.gcf()
軸を指定せずにplt.xlabel('x')等の軸の操作をすると、現在の軸が操作される。また現在の軸は、plt.axes()で指定できる。
ax = plt.subplot(111)
plt.axes(ax)
axesはインスタンスで指定するが、figureは通し番号で指定するようだ。
fig = plt.figure()
plt.figure(fig.number)
以下幸せになれるかもしれない実例を挙げる。
データ
import numpy as np
import matplotlib.pyplot as plt

x  = np.linspace(-np.pi, np.pi, 100)
y1 = np.sin(x)
y2 = np.cos(x)
開いているfigureを通し番号をつけて全て保存
fignums = plt.get_fignums()

for i, fignum in enumerate(fignums):
    plt.figure(fignum)
    plt.savefig(str(i)+'.pdf')
figureからaxesを取ってきて、軸毎に処理をする
plt.figure()

plt.subplot(1,2,1)
plt.plot(x, y1)

plt.subplot(1,2,2)
plt.plot(x, y2)

axes = plt.gcf().get_axes()

for axis in axes:
    plt.axes(axis)

    # 以下軸ごとの処理
    plt.grid()
    .
    .
    .
linesのyの値をすべて取得
plt.figure()
plt.plot(x,y1)
plt.plot(x,y2)

Y = []

lines  = plt.gca().get_lines()
for line in lines:
    y = line.get_ydata()
    Y.append(y) # Y[y1, y2]
linesから値をとる
line, = plt.plot(x, y1)
line.get_data()  # (x,y1)
line.get_xdata() # x
line.get_ydata() # y
linesに値を指定する
line, = plt.plot(x, y1)
line.set_data(x, y2)
line.set_xdata(x)
line.set_ydata(y)
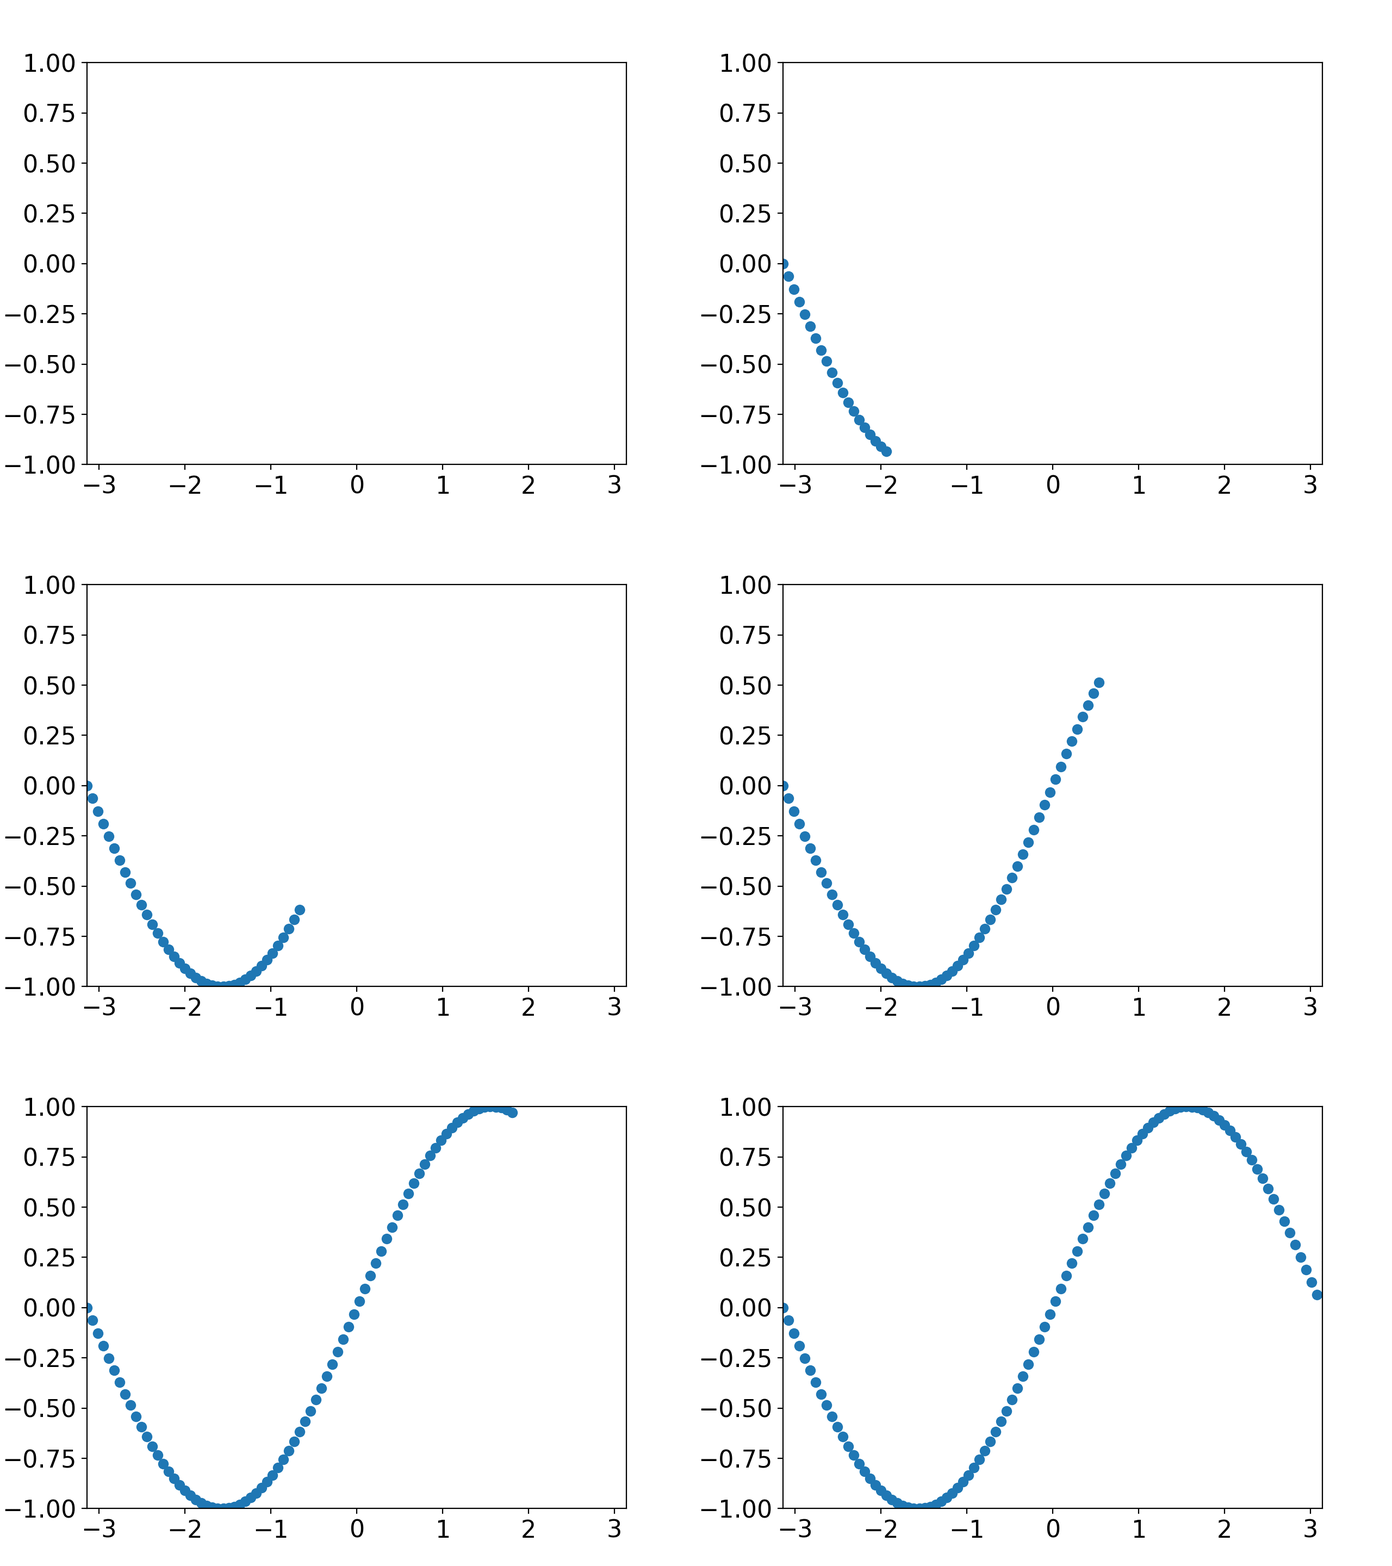
Animationでlinesの値だけを変える
import matplotlib.animation as animation
fig = plt.figure()
line, = plt.plot(x[0], y1[0], 'o')

plt.xlim([x[0], x[-1]])
plt.ylim([-1, 1])

def update(i):
    line.set_data(x[:i], y1[:i])

ani = animation.FuncAnimation(fig, update)
plt.show()
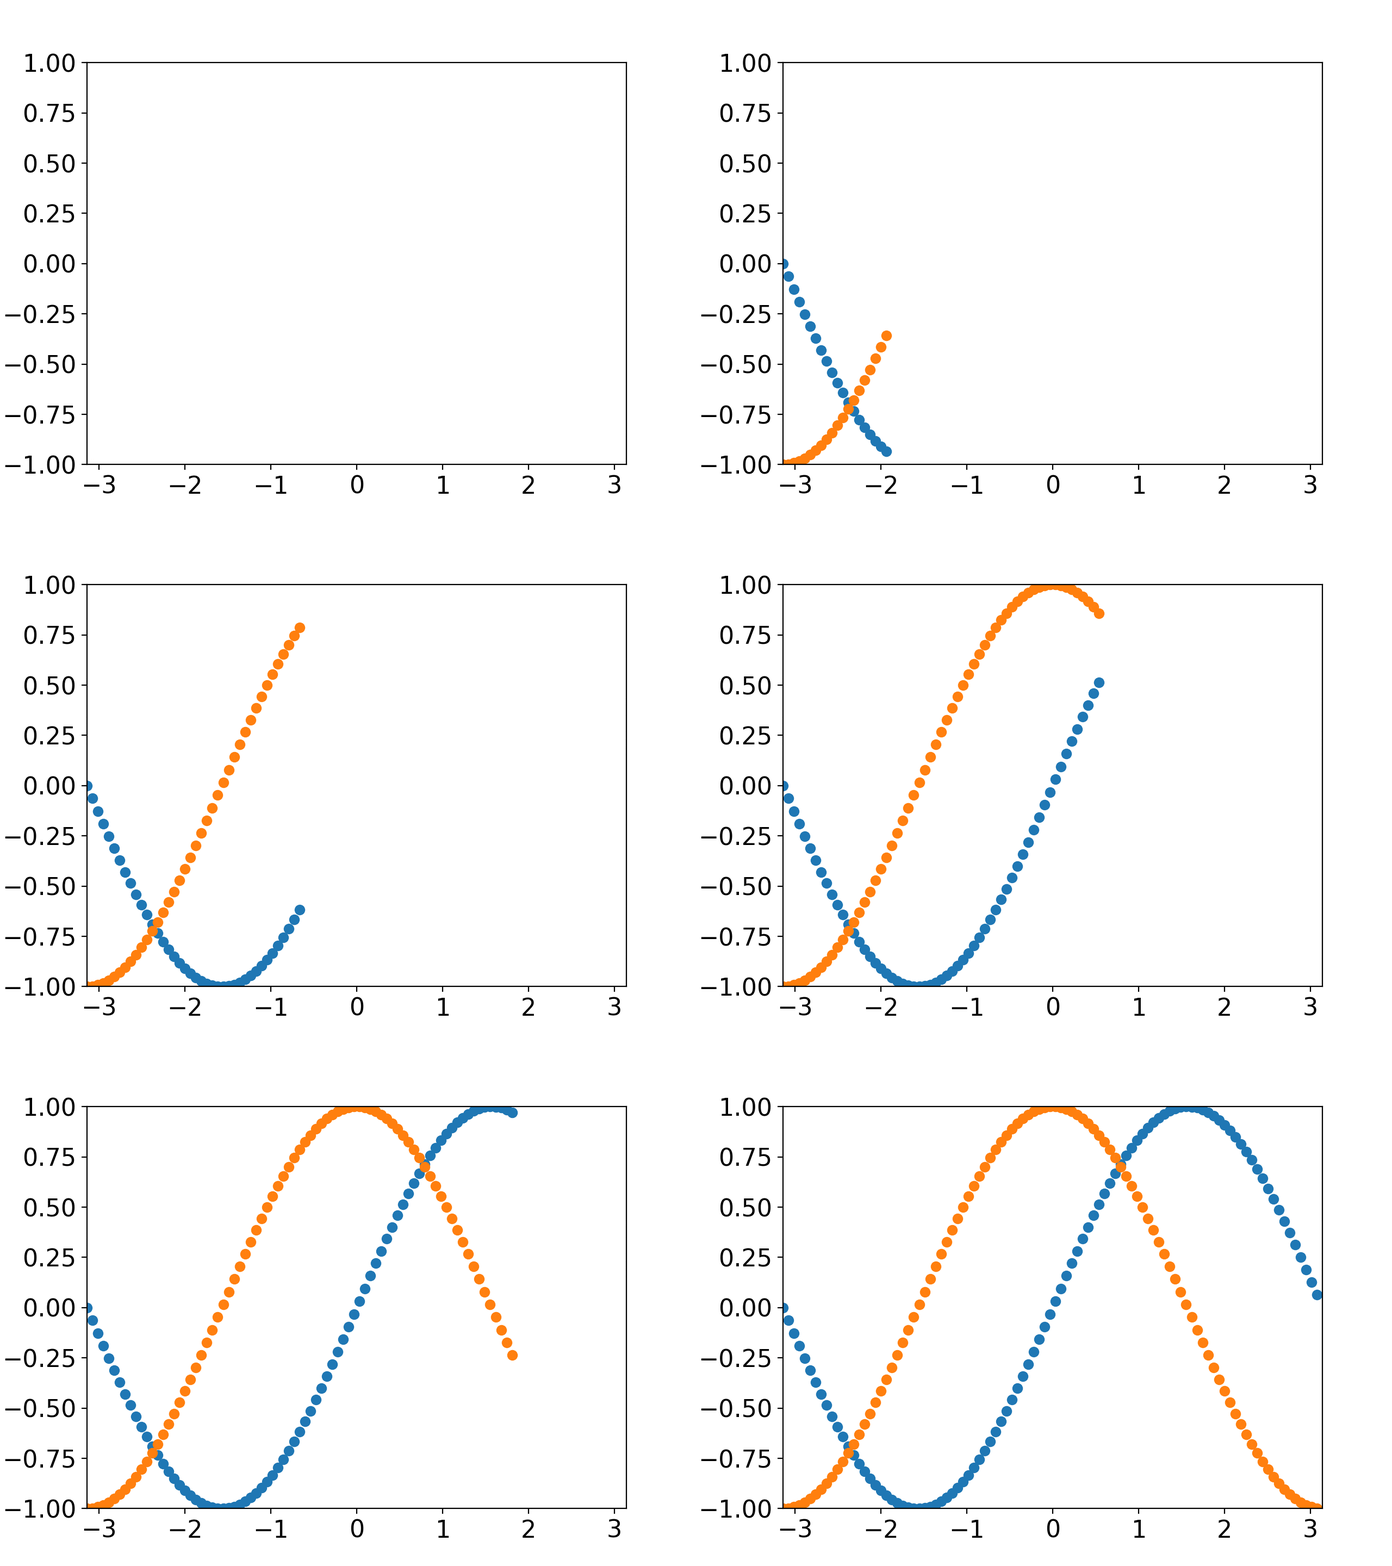
Animationでlinesの値だけを変える(2)
import matplotlib.animation as animation
fig = plt.figure()

Y = [y1, y2]
for y in Y:
    plt.plot(x[0], y[0],'o')

lines = plt.gca().get_lines()

plt.xlim([x[0], x[-1]])
plt.ylim([-1, 1])

def update(i):
    for j, line in enumerate(lines):
        line.set_data(x[:i], Y[j][:i])

ani = animation.FuncAnimation(fig, update)
plt.show()
(おまけ)全てのfigureの全てのaxesの全てのlinesのyの値を取得する
Y = []
fignums = plt.get_fignums()
for fignum in fignums:
    axes = plt.figure(fignum).get_axes()
    for axis in axes:
        lines = axis.get_lines()
        for line in lines:
             y = line.get_ydata()
             Y.append(y)


