前段
前回の記事では、ほぼ貼り付けでタグクラウド型Chartが作成できる方法をご紹介しましたが、
今回はより開発しやすいよう、様々なTipsを挙げていきます。

データの呼び出し
generateChart変数に関数を設定し、optionsと引数を与えることで、Yellowfinのデータタブで用意したデータが参照できるようになります。

debugのやり方
上の画像でも入力されていましたが、debugger;を記述することで、breakpointを設置することができます。ライブラリ中でも可能です。

chromeデベロッパーツール(windowsではF12、Macではcommand+option+i)を開き、
プレビュータブに移ることで設定したbreakpointでオブジェクトの中身等を確認できます。

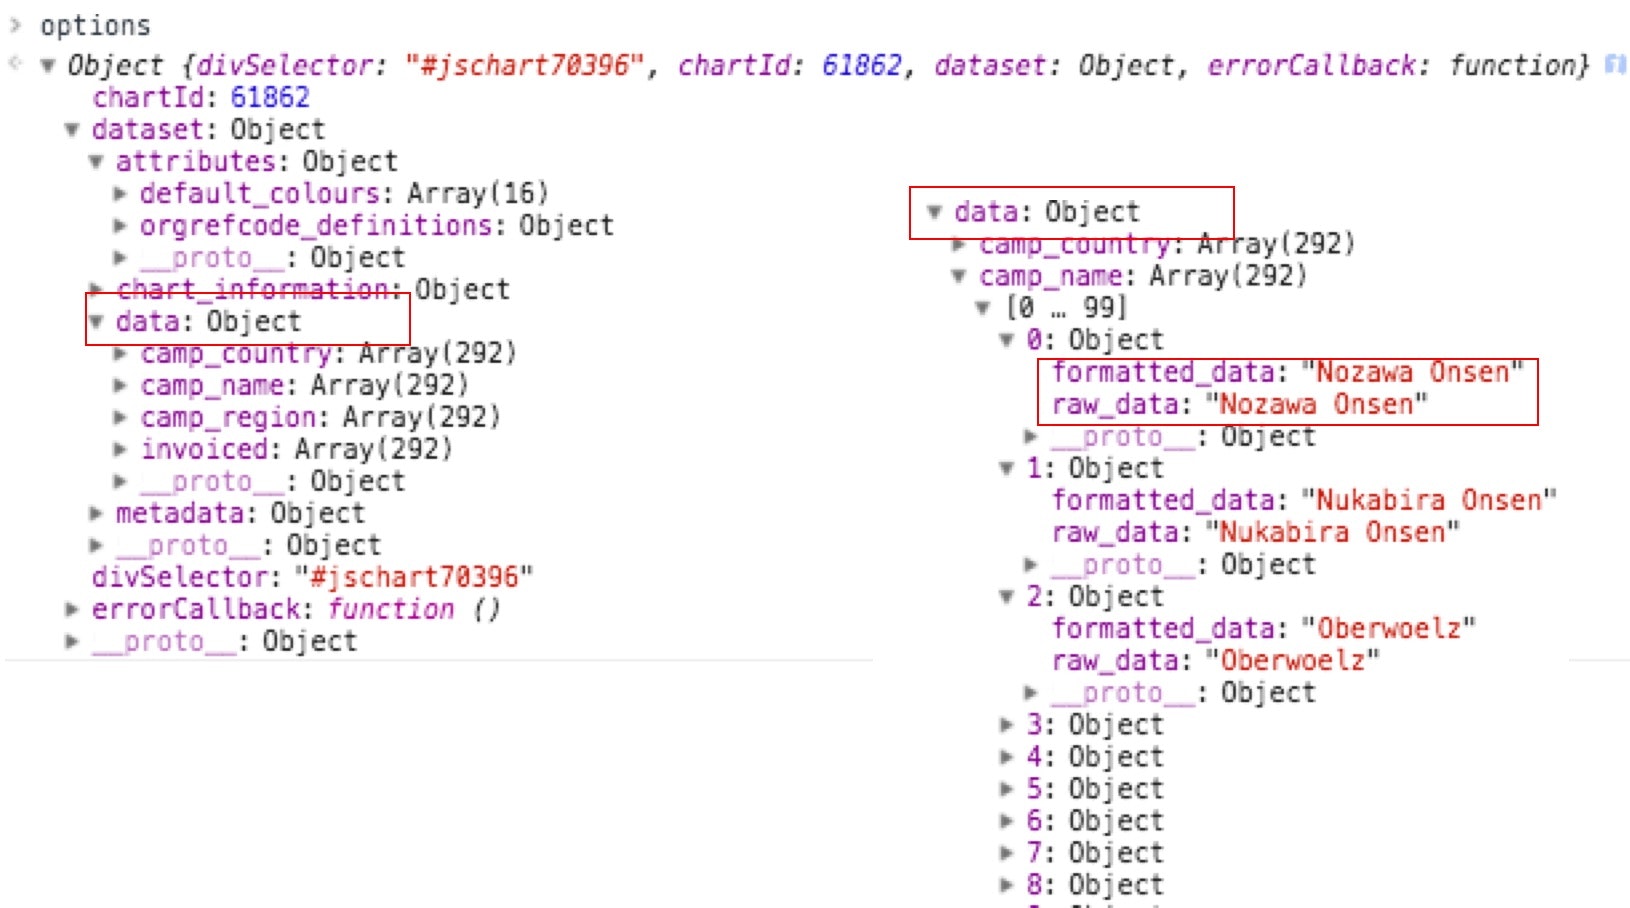
Yellowfinのoutput型(Objectとは)
オブジェクトとしてまずoutputされる。アクセスには中の子どもを参照する。

データはdataのObjectの中に入っており、その下にカラム名、データが格納されている。
アクセスしたいデータにフォーカスするとこんな感じ
options:Object
-dataset:Object
--data:Object
---カラム名:Array
----カラム名[n]:Object
-----formatted_data
-----raw_data
おまけ(JavascriptChart作成で重要なこと)
なんらかのライブラリを使用する場合、 YellowfinからのOutputの型、そして、そのライブラリのinputの型を合わせることが必要です。
これはここだけの話しではなく、バッチ処理、データ移行処理の基本ですね。

ちなみに右上のライブラリは前回作成したd3-cloudライブラリのオブジェクト型です。