任意の3次近似式を書きたい(そんな人いないだろうけど)
色々な3次近似式の係数を求めたかったので、ちょっと作ってみた。
クリックしたら、点を追加して、追加した点群で近似式を求めて描画。
ついでに一定の幅を持った線も追加。
そのまま捨てるのももったいないので、公開。
%matplotlib widget

import numpy as np
import matplotlib.pyplot as plt
import matplotlib.widgets as wg

fig = plt.figure(figsize=(20,5))
ax = plt.gca()
ax.set_xlim(-10, 110)
ax.set_ylim(-20, 20)
ax.set_aspect("equal")
plt.grid()

x0 = np.array([])
y0 = np.array([])
pLine0, = plt.plot(x0, y0, "x")
pLine1, = plt.plot([], [], "-")
pLine2, = plt.plot([], [], "-")
pLine3, = plt.plot([], [], "-")
pText1 = plt.text(-9, -17, "")
pText2 = plt.text(-9, -19, "")

x = np.linspace(0, 100, 1000)

def onclick(event):
    global x0, y0
    x0 = np.append(x0, event.xdata)
    y0 = np.append(y0, event.ydata)
    idx = np.argsort(x0)
    x0 = x0[idx]
    y0 = y0[idx]
    pLine0.set_data(x0, y0)

    c3, c2, c1, c0 = list(np.polyfit(x0, y0, 3))
    y1 = c3 * x ** 3 + c2 * x**2 + c1 * x + c0
    pLine1.set_data(x, y1)


    d = 3.3 / 2
    dy1 = 3 * c3 * x ** 2 + 2 * c2 * x + c1
    l = d / np.sqrt(1 + np.power(dy1, 2))

    x2 = x - dy1 * l
    y2 = y1 + l

    x3 = x + dy1 * l
    y3 = y1 - l

    pLine2.set_data(x2, y2)
    pLine3.set_data(x3, y3)

    # ax.relim()
    # ax.autoscale_view()
    plt.draw()
    pText1.set_text(f'dblclick={event.dblclick}, button={event.button}, x={event.x}, y={event.y}, xdata={event.xdata:.3f}, ydata={event.ydata:.3f}')
    pText2.set_text(f'c3={c3}, c2={c2}, c1={c1}, c0={c0}')


cid = fig.canvas.mpl_connect('button_press_event', onclick)
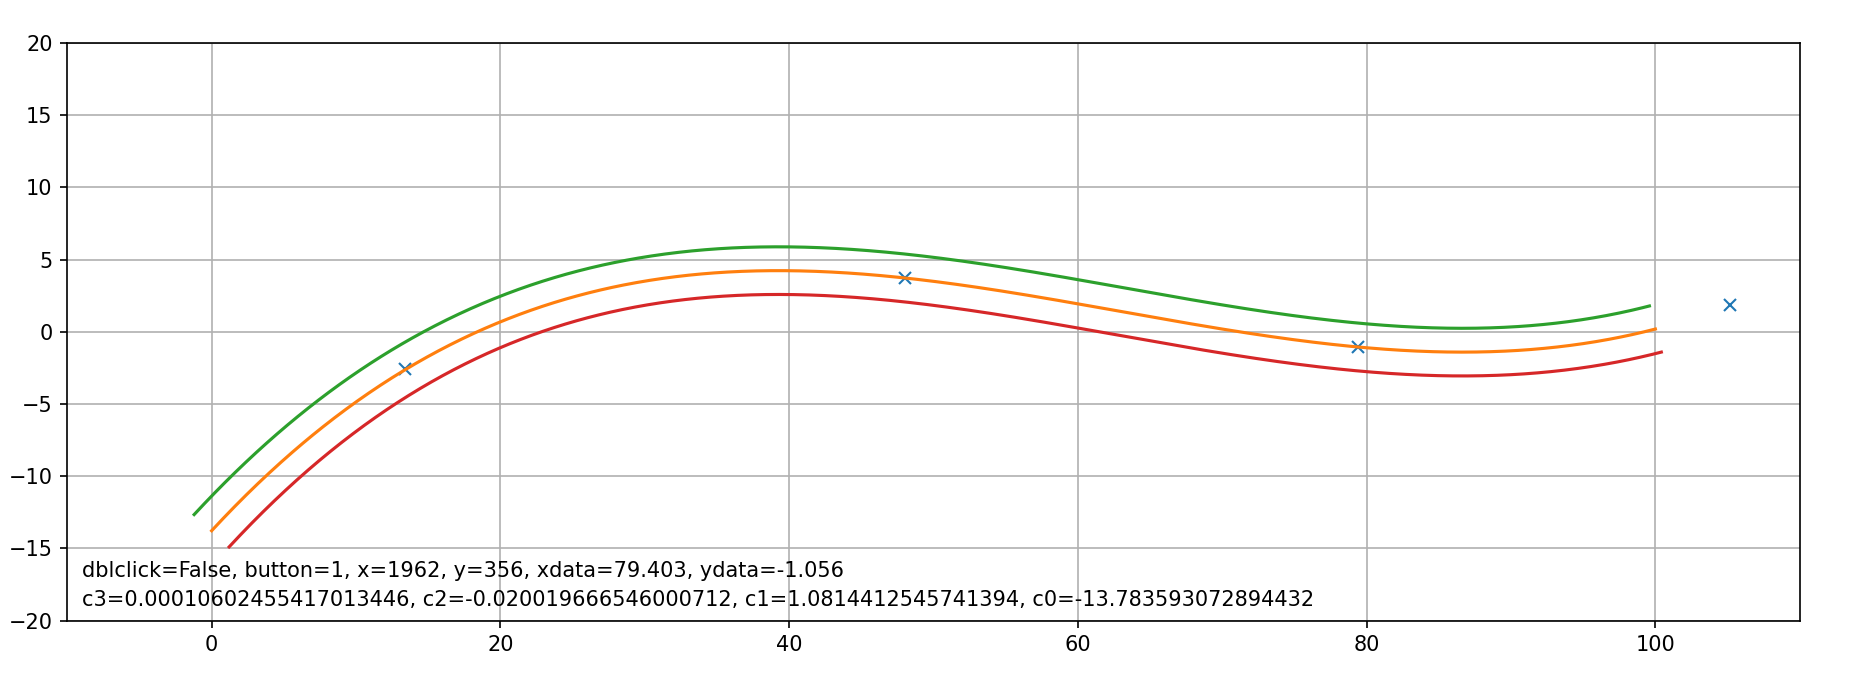
動作イメージ
ほんとは
スケールも自動でしてほしかったけど、面倒だったのでなしで。
あとはredoも。。。
ax.relim()
ax.autoscale_view()