複数の分布をヒストグラムで比較したい場合
思ったようなグラフを書こうと思ったら、色々彷徨ったのでメモ。
できることが多いのはいいけど、どれがベストかすぐに判断しにくいのは厄介。。。
import matplotlib.pyplot as plt
import seaborn as sns
import numpy as np
import pandas as pd
param = [ ("M01", -75, 4), ("M02", -79, 5), ("F01", -81, 3), ("F02", -82, 5) ]
data = [[name, np.random.normal(loc, scale)] for name, loc, scale in param for i in range(100)]
df = pd.DataFrame(data, columns=["spk","rms"])
print(df)
df.hist(column="rms", by='spk', sharex=True, sharey=True, figsize=(7,7), layout=(2,2))
plt.show()
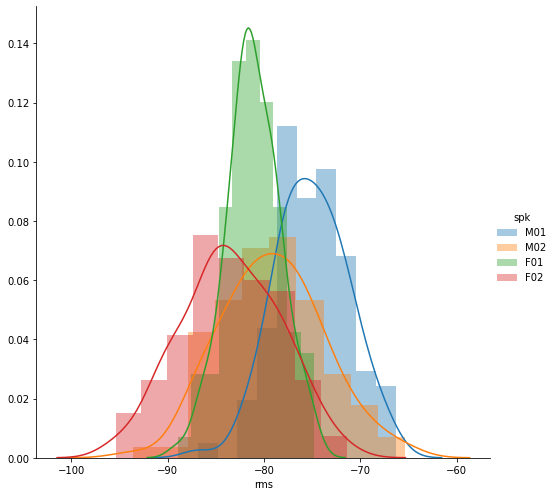
g = sns.FacetGrid(df, hue="spk", height=7)
g.map(sns.distplot, "rms", label="spk")
g.add_legend()
plt.show()
     spk        rms
0    M01 -70.771956
1    M01 -71.254004
2    M01 -77.829105
3    M01 -73.486316
4    M01 -71.048432
..   ...        ...
395  F02 -83.557042
396  F02 -81.383104
397  F02 -78.089854
398  F02 -81.057188
399  F02 -93.473633

[400 rows x 2 columns]