ReSpeaker 4-Mic Linear Array Kit のインパルス応答を測定してみた
ReSpeaker 4-Mic Linear Array Kit のインパルス応答をPythonでスピーカの周波数特性を分析を見てやってみた。
といっても,無響室でもなく,市販スピーカ(ONKYO GX-R3X)を使ってだけど。
マイクとスピーカ間の周波数特性
ReSpeakerのミニジャックにスピーカを繋いで,1メートル離れたところから,TSPとPink TSP信号を再生。
その周波数特性がこの図。ちゃんとした収録環境でないからか?,ギザギザな特性。
それにスピーカの特性もわからないから,スピーカとマイク両方の特性が畳み込まれてる。

参照信号の周波数特性
ちなみに,ReSpeakerは再生信号(参照信号)も録音できるので,この特性も見てみた。
7chはNormal TSPとPink TSP両方から取得した特性が一致した。ミニジャックから音声出力する際はこのチャンネルを使うべきかと。
8chはなぜかNormal TSPの方だとギザギザが。それに高域が若干下がっている。JST 2.0側にスピーカをつけていないためか わからないけど。

マイク正面のインパルス応答
こっちがインパルス応答。再生信号(参照信号)も一緒に収録。
ちなみに,仮に下記だとすると
- マイクのインパルス応答の開始: $157$サンプル
- 参照信号のインパルス信号の開始: $7$サンプル
- 音速: $343.5\mathrm{m/s}$
マイクとスピーカの距離は $(159 - 7) \div 48\mathrm{kHz} \times 343.5\mathrm{m/s} \fallingdotseq 1.09 \mathrm{m} $ ということになるはず。大体あってる?

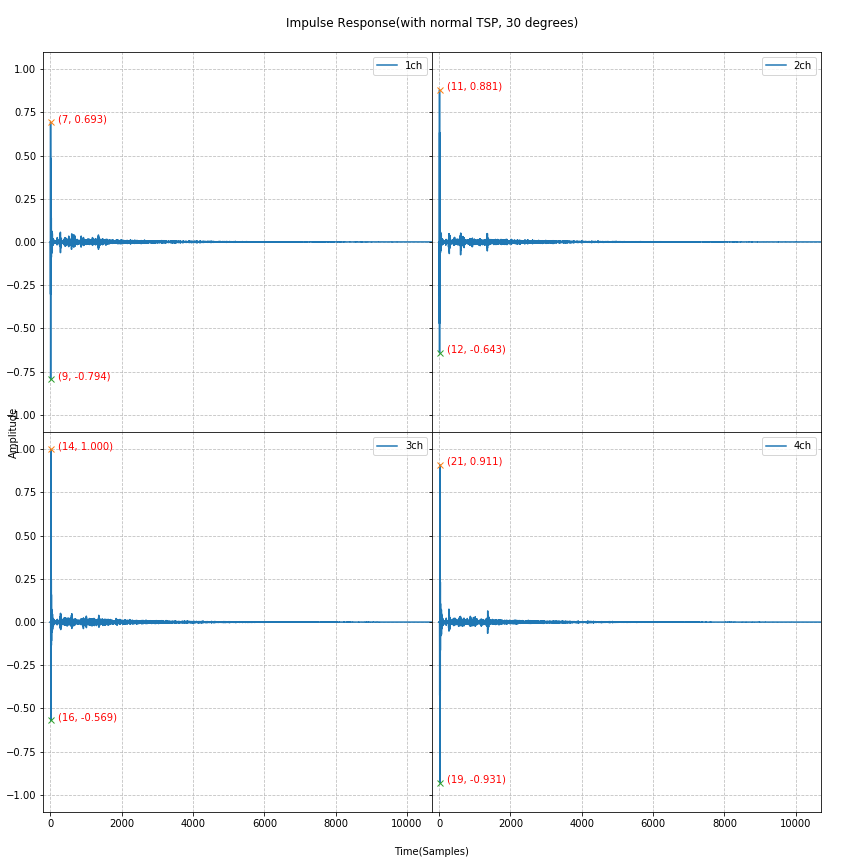
マイク回転時のインパルス応答
それと,30,60度マイクを回転させてインパルス応答を取得。なお,各マイク間は$5 \mathrm{cm}$。
- 30度のとき両端の遅延は$15 \mathrm{cm} \times \sin(30{}^\circ) = 7.5\mathrm{cm}$。
インパルス応答の開始は $7, 11, 14, 19$で,両端の差が$12$ なので$12 \div 48\mathrm{kHz} \times 343.5\mathrm{m/s} \fallingdotseq 8.6\mathrm{cm} $ - 30度のとき両端の遅延は$15 \mathrm{cm} \times \sin(60{}^\circ) \fallingdotseq 12.99\mathrm{cm}$。
インパルス応答の開始は $7, 13, 19, 25$で,両端の差が$18$ なので$18 \div 48\mathrm{kHz} \times 343.5\mathrm{m/s} \fallingdotseq 12.88\mathrm{cm} $

解析プログラム
tsp_design.py
import numpy as np
import soundfile as sf

def normal_tsp(n, gain=50, repeat=1, offset=0):
    N = 2**n
    m = N//4

    L = N//2 - m
    k = np.arange(0, N)

    tsp_freq = np.zeros(N, dtype=np.complex128)
    tsp_exp = np.exp(-1j*4*m*np.pi*(k/N)**2)

    tsp_freq[0:N//2+1] = tsp_exp[0:N//2+1]
    tsp_freq[N//2+1: N+1] = np.conj(tsp_exp[1 : N//2][::-1])

    tsp_inv_freq = 1 / tsp_freq

    tsp = np.real(np.fft.ifft(tsp_freq))
    tsp = gain * np.roll(tsp, L)

    tsp_repeat = np.r_[np.zeros(offset), np.tile(tsp, repeat), np.zeros(N)]

    tsp_inv = np.real(np.fft.ifft(tsp_inv_freq))
    tsp_inv =  gain * np.roll(tsp_inv, -L)

    return tsp_repeat, tsp_inv

def pink_tsp(n, gain=50, repeat=1, offset=0):

    N = 2**n
    m = N//4

    L = N//2 - m
    k = np.arange(1, N)

    a = 4 * m * np.pi / (N * np.log(N/2))

    tsp_freq = np.zeros(N, dtype=np.complex128)
    tsp_exp = np.exp(1.j * a * k * np.log(k)) / np.sqrt(k)

    tsp_freq[0] = 1
    tsp_freq[1:N//2+1] = tsp_exp[1:N//2+1]
    tsp_freq[N//2+1: N+1] = np.conj(tsp_exp[1 : N//2][::-1])

    tsp_inv_freq = 1 / tsp_freq

    tsp = gain * np.real(np.fft.ifft(tsp_freq))[::-1]
    tsp =  gain * np.roll(tsp, L)
    tsp_repeat = np.r_[np.zeros(offset), np.tile(tsp, repeat), np.zeros(N)]

    tsp_inv = np.real(np.fft.ifft(tsp_inv_freq))[::-1]
    tsp_inv =  gain * np.roll(tsp_inv, L)

    return tsp_repeat, tsp_inv

def store_normal_tsp(filename, n, gain=50, repeat=1, offset=0, fs=48000, subtype='PCM_32'):
  tsp, tsp_inv = normal_tsp(n, gain, repeat, offset * fs)
  sf.write(filename, tsp, fs, subtype=subtype)

def store_pink_tsp(filename, n, gain=50, repeat=1, offset=0, fs=48000, subtype='PCM_32'):
  tsp, tsp_inv = pink_tsp(n, gain, repeat, offset * fs)
  sf.write(filename, tsp, fs, subtype=subtype)


def sychronous_addition(filename, repeat, offset, n):
    '''
    filename : Name of wav file (str)
    repeat : Number of repetition (int)
    N : Length of input signal (int)
    '''
    data, fs = sf.read(filename)

    N = 2 ** n
    assert len(data) > offset * fs + repeat * N

    mean = np.zeros((N, data.shape[1]))
    for i in range(repeat):
        mean += data[offset * fs + i * N : offset * fs + (i + 1) * N]
    mean = mean / repeat

    return mean, fs

def make_impulse_response(filename, repeat, offset, n, tsp_generator):
    mean, fs = sychronous_addition(filename, repeat, offset, n)

    tsp, tsp_inv = tsp_generator(n)

    tsp_inv_freq = np.fft.fft(tsp_inv)
    mean_freq = np.fft.fft(mean, axis=0)

    H = mean_freq * np.c_[tsp_inv_freq]

    h = np.real(np.fft.ifft(H, axis=0))
    h /= np.max(np.abs(h))

    s = np.min([np.min(np.where(np.abs(x) > 0.1)[0], initial=len(x)) for x in h.T]) - 5
    e = s + fs # 1s
    h = h[s:e]

    return H, h, fs
import numpy as np
import matplotlib.pyplot as plt
import tsp_design
import os


def plot_frequency_response(freq_resp_list, suffix):
    f = [np.linspace(0, fs/2, N//2) for (t, c, fs, H) in freq_resp_list]
    H = [np.abs(H[1:N//2] / np.max(np.abs(H), axis=0)) for (t, c, fs, H) in freq_resp_list]
    #ymin = np.log(np.min([np.min(x) for x in H]))

    fig = plt.figure(figsize=(15, 9))
    axs = fig.subplots(2, 2, sharex=True, sharey=True)
    fig.subplots_adjust(hspace=0, wspace=0, left=0.05, right=0.95, bottom=0.06, top=0.94)
    for i in range(4):
        x = i // 2
        y = i %  2
        for j, (t, c, _, _) in enumerate(freq_resp_list):
            axs[x][y].plot(f[j][1:], np.log(H[j][:,i]), color=c,  label="%s TSP: %dch" % (t ,i + 1))
        axs[x][y].legend()
        axs[x][y].set_xscale('log')
        axs[x][y].set_xlim(20, 20000)
        axs[x][y].set_ylim(-15, 1)

    fig.suptitle('Frequency Response(%s)' % angles[suffix])
    fig.text(0.5, 0.01, 'Frequency[Hz]', ha='center')
    fig.text(0.01, 0.5, 'Level[dB]', va='center', rotation='vertical')
    plt.legend()
    plt.savefig(dirname + "/FreqRes%s.png" % suffix)

def plot_impulse_response(title, prefix, suffix, h):
    fig = plt.figure(figsize=(18, 12))
    axs = fig.subplots(2, 4, sharex=True, sharey=True)
    fig.subplots_adjust(hspace=0, wspace=0, left=0.05, right=0.95, bottom=0.06, top=0.94)
    for i in range(8):
        x = i // 4
        y = i %  4
        axs[x][y].plot(h[:, i], label="%dch" % (i + 1))

        def plot_peak(peak_x):
            peak_y = h[peak_x, i]
            if np.abs(peak_y) > 0.1:
                axs[x][y].plot(peak_x, peak_y, "x")
                axs[x][y].annotate("(%d, %.3f)" % (peak_x, peak_y), xy=(peak_x + 200, peak_y), color = "red")

        plot_peak(np.argmax(h[:, i]))
        plot_peak(np.argmin(h[:, i]))


        axs[x][y].legend()
        axs[x][y].grid(alpha = 0.8, linestyle = "--")
        axs[x][y].set_xlim(-200, 10700)
        axs[x][y].set_ylim(-1.1, 1.1)

    fig.suptitle(title)
    fig.text(0.5, 0.01, 'Time(Samples)', ha='center')
    fig.text(0.01, 0.5, 'Amplitude', va='center', rotation='vertical')
    plt.legend()
    plt.savefig(dirname + "/%s%s.png" % (prefix, suffix))
    #plt.show()


dirname = "figure"
os.makedirs(dirname, exist_ok=True)

n      = 18
N      = 2**n
repeat = 30
offset = 1

suffixes = ['-R60', '-R30', '-R00', '+R30', '+R60']
angles   = dict(zip(suffixes,
                    ['-60 degrees', '-30 degrees', '0 degrees', '30 degrees', '60 degrees']))

for suffix in suffixes:
    #suffix = suffixes[2]
    norm_filename = 'tsp-nor%s.wav'  % suffix
    norm_H, norm_h, norm_fs = tsp_design.make_impulse_response(norm_filename, repeat, offset, n, tsp_design.normal_tsp)

    pink_filename = 'tsp-pink%s.wav' % suffix
    pink_H, pink_h, pink_fs = tsp_design.make_impulse_response(pink_filename, repeat, offset, n, tsp_design.pink_tsp)

    plot_frequency_response([
            ("Normal", "red", norm_fs, norm_H),
            ("Pink", "blue", pink_fs, pink_H),
            ], suffix)

    plot_impulse_response('Impulse Response(with normal TSP, %s)' % angles[suffix], "ImpRes-nor", suffix, norm_h)
    plot_impulse_response('Impulse Response(with pink TSP, %s)' % angles[suffix], "ImpRes-pink", suffix, pink_h)