Rにてggplotを使う際の忘備録を残しておきます
基本的なグラフの描画
基本的にはデータを指定してあとは好きなグラフを指定するという仕組み
ggplotにもとから入っているdiamondsデータを用いて基本的なグラフを描画します
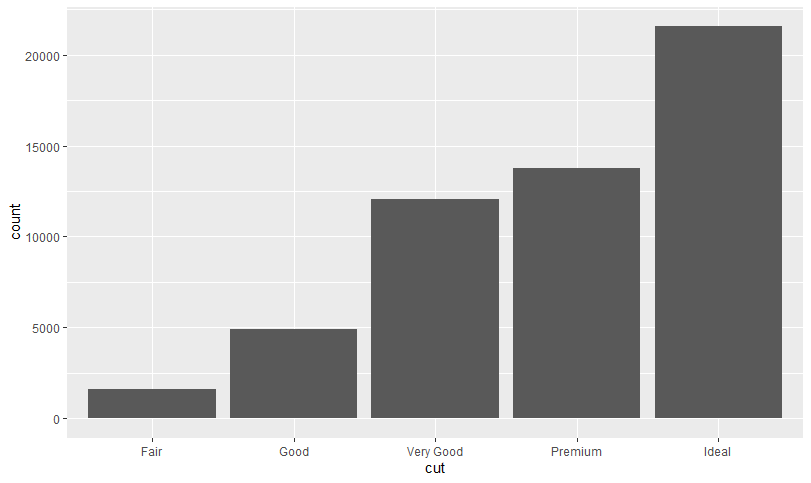
棒グラフ
bar.R
ggplot(data=diamonds)+
  geom_bar(mapping = aes(x = cut))
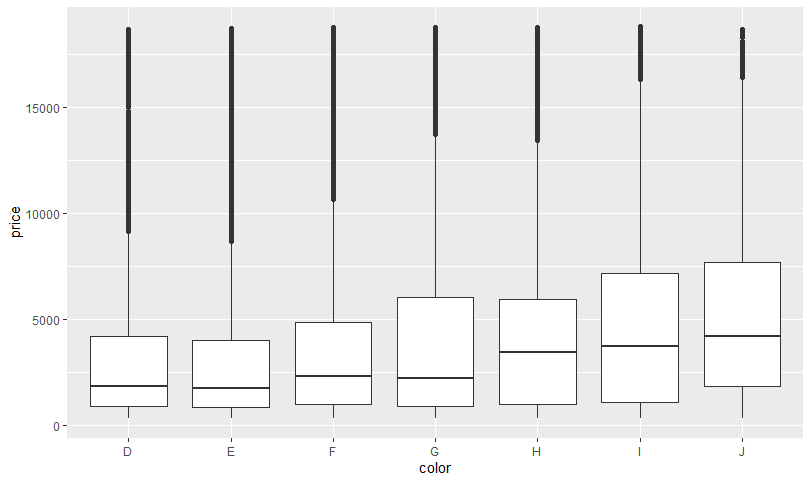
箱ひげ図
boxplot.R
ggplot(data = diamonds)+
  geom_boxplot(mapping = aes(x=color,y=price))
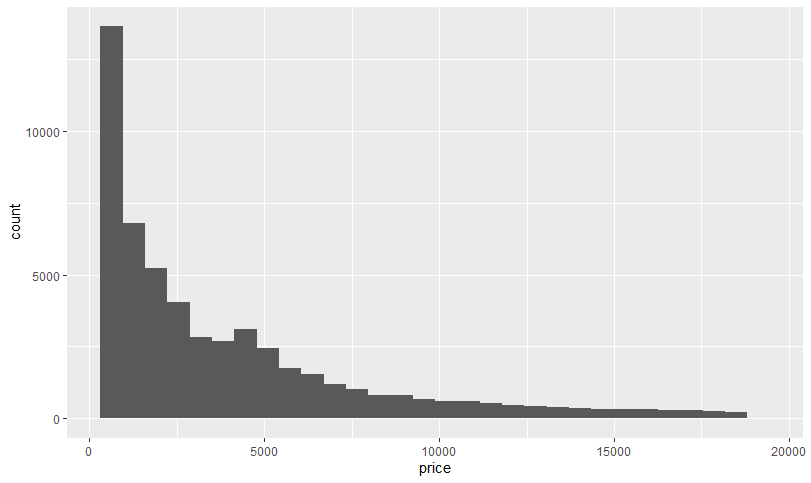
ヒストグラム
hist.R
ggplot(data=diamonds)+
  geom_histogram(mapping=aes(x=price))
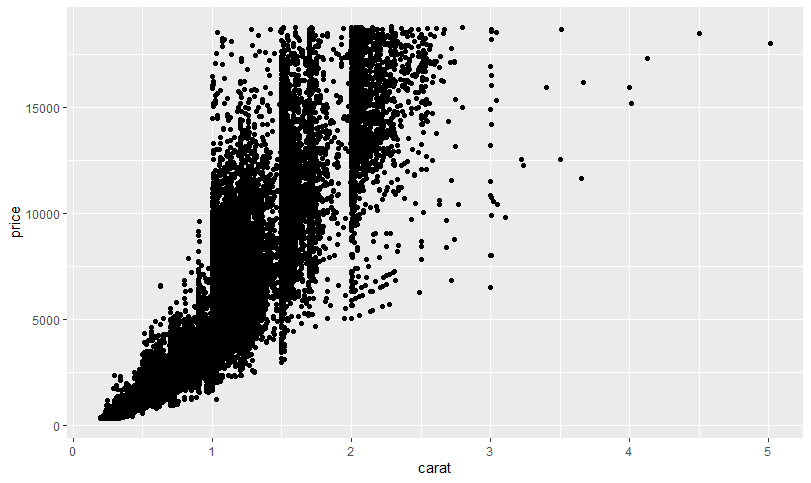
散布図
横軸:色,縦軸:価格としています
scatter.R
ggplot(data = diamonds)+
  geom_boxplot(mapping = aes(x=carat,y=price))
おまけ
省略方法
dataやmappingといったものは省略することが出来ます
また,同じデータを用いて色々なグラフを描画する際にはこうやって書くと便利です
syouryaku.R
# 箱ひげ図の例
gg = ggplot(diamonds,aes(x=carat,y=price))
gg + geom_boxplot()
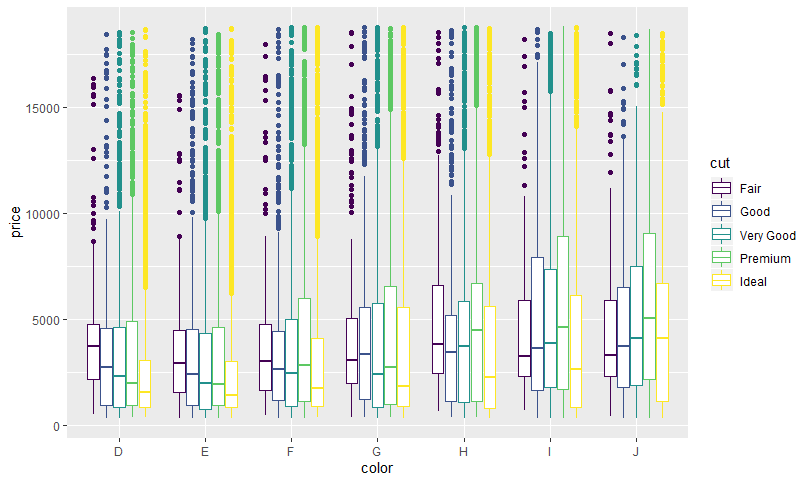
色でわける
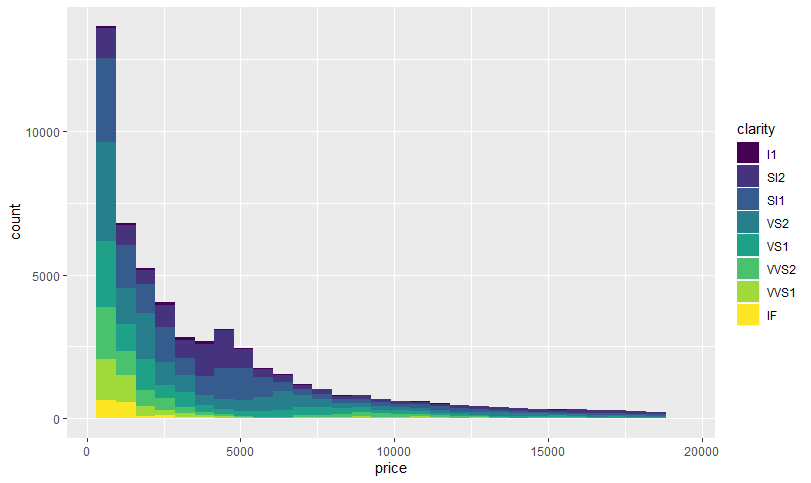
aesの中にcolorやfillを指定することでグラフを色分けすることが出来ます
colorとfillはグラフによってわかりやすさが変わるので使い分けが必要です
color.R
ggdia = ggplot(diamonds,aes(x=carat,y=price))
# colorで色分け
ggdia +geom_boxplot(aes(color = cut))
fill.R
ggdia = ggplot(data =diamonds)

# fillで色分け
ggdia + geom_histogram(aes(price,fill = clarity))
