はじめに
初めまして。
CryptoGamesというブロックチェーンゲーム企業でエンジニアをしている cardene(かるでね) です!
スマートコントラクトを書いたり、フロントエンド・バックエンド・インフラと幅広く触れています。
代表的なゲームはクリプトスペルズというブロックチェーンゲームです。
今回は最近話題のChatGPTの『Code Interpreter』を使用して、NFTの取引データを分析するということをしていこうと思います。
NFTや仮想通貨のデータ分析や何かしらのオンチェーンデータ分析に役立つと思い試してみたので、この記事に手順や結果についてまとめていきます。
この記事ではあくまでやり方を紹介するだけなので、具体的な分析などは行いません。
データの用意
前提
『Code Interpreter』でデータ分析を行うには、CSVなどのデータを入力する必要があります。
そのため、今回は『Dune Analytics』を使用してデータを取得します。
『Dune Analytics』は、無料で利用できるブロックチェーンデータ分析ツールです。
『Dune Analytics』内のデータに対してクエリをかけることで、特定のデータをすぐに取得したりグラフ表示することができます。
また、多くの他のユーザーがクエリやグラフをダッシュボードとして作成して公開してくれています。
もちろん『Dune Analytics』内で可視化したり、分析する方が早いことは早いですが、テキストだけでも分析できるのであればやってみる価値はあります。
早速データを用意してみましょう!
Sign up
まずは以下にアクセスしてください。
右上の「Sign up」をクリックすると以下の画面が表示されます。
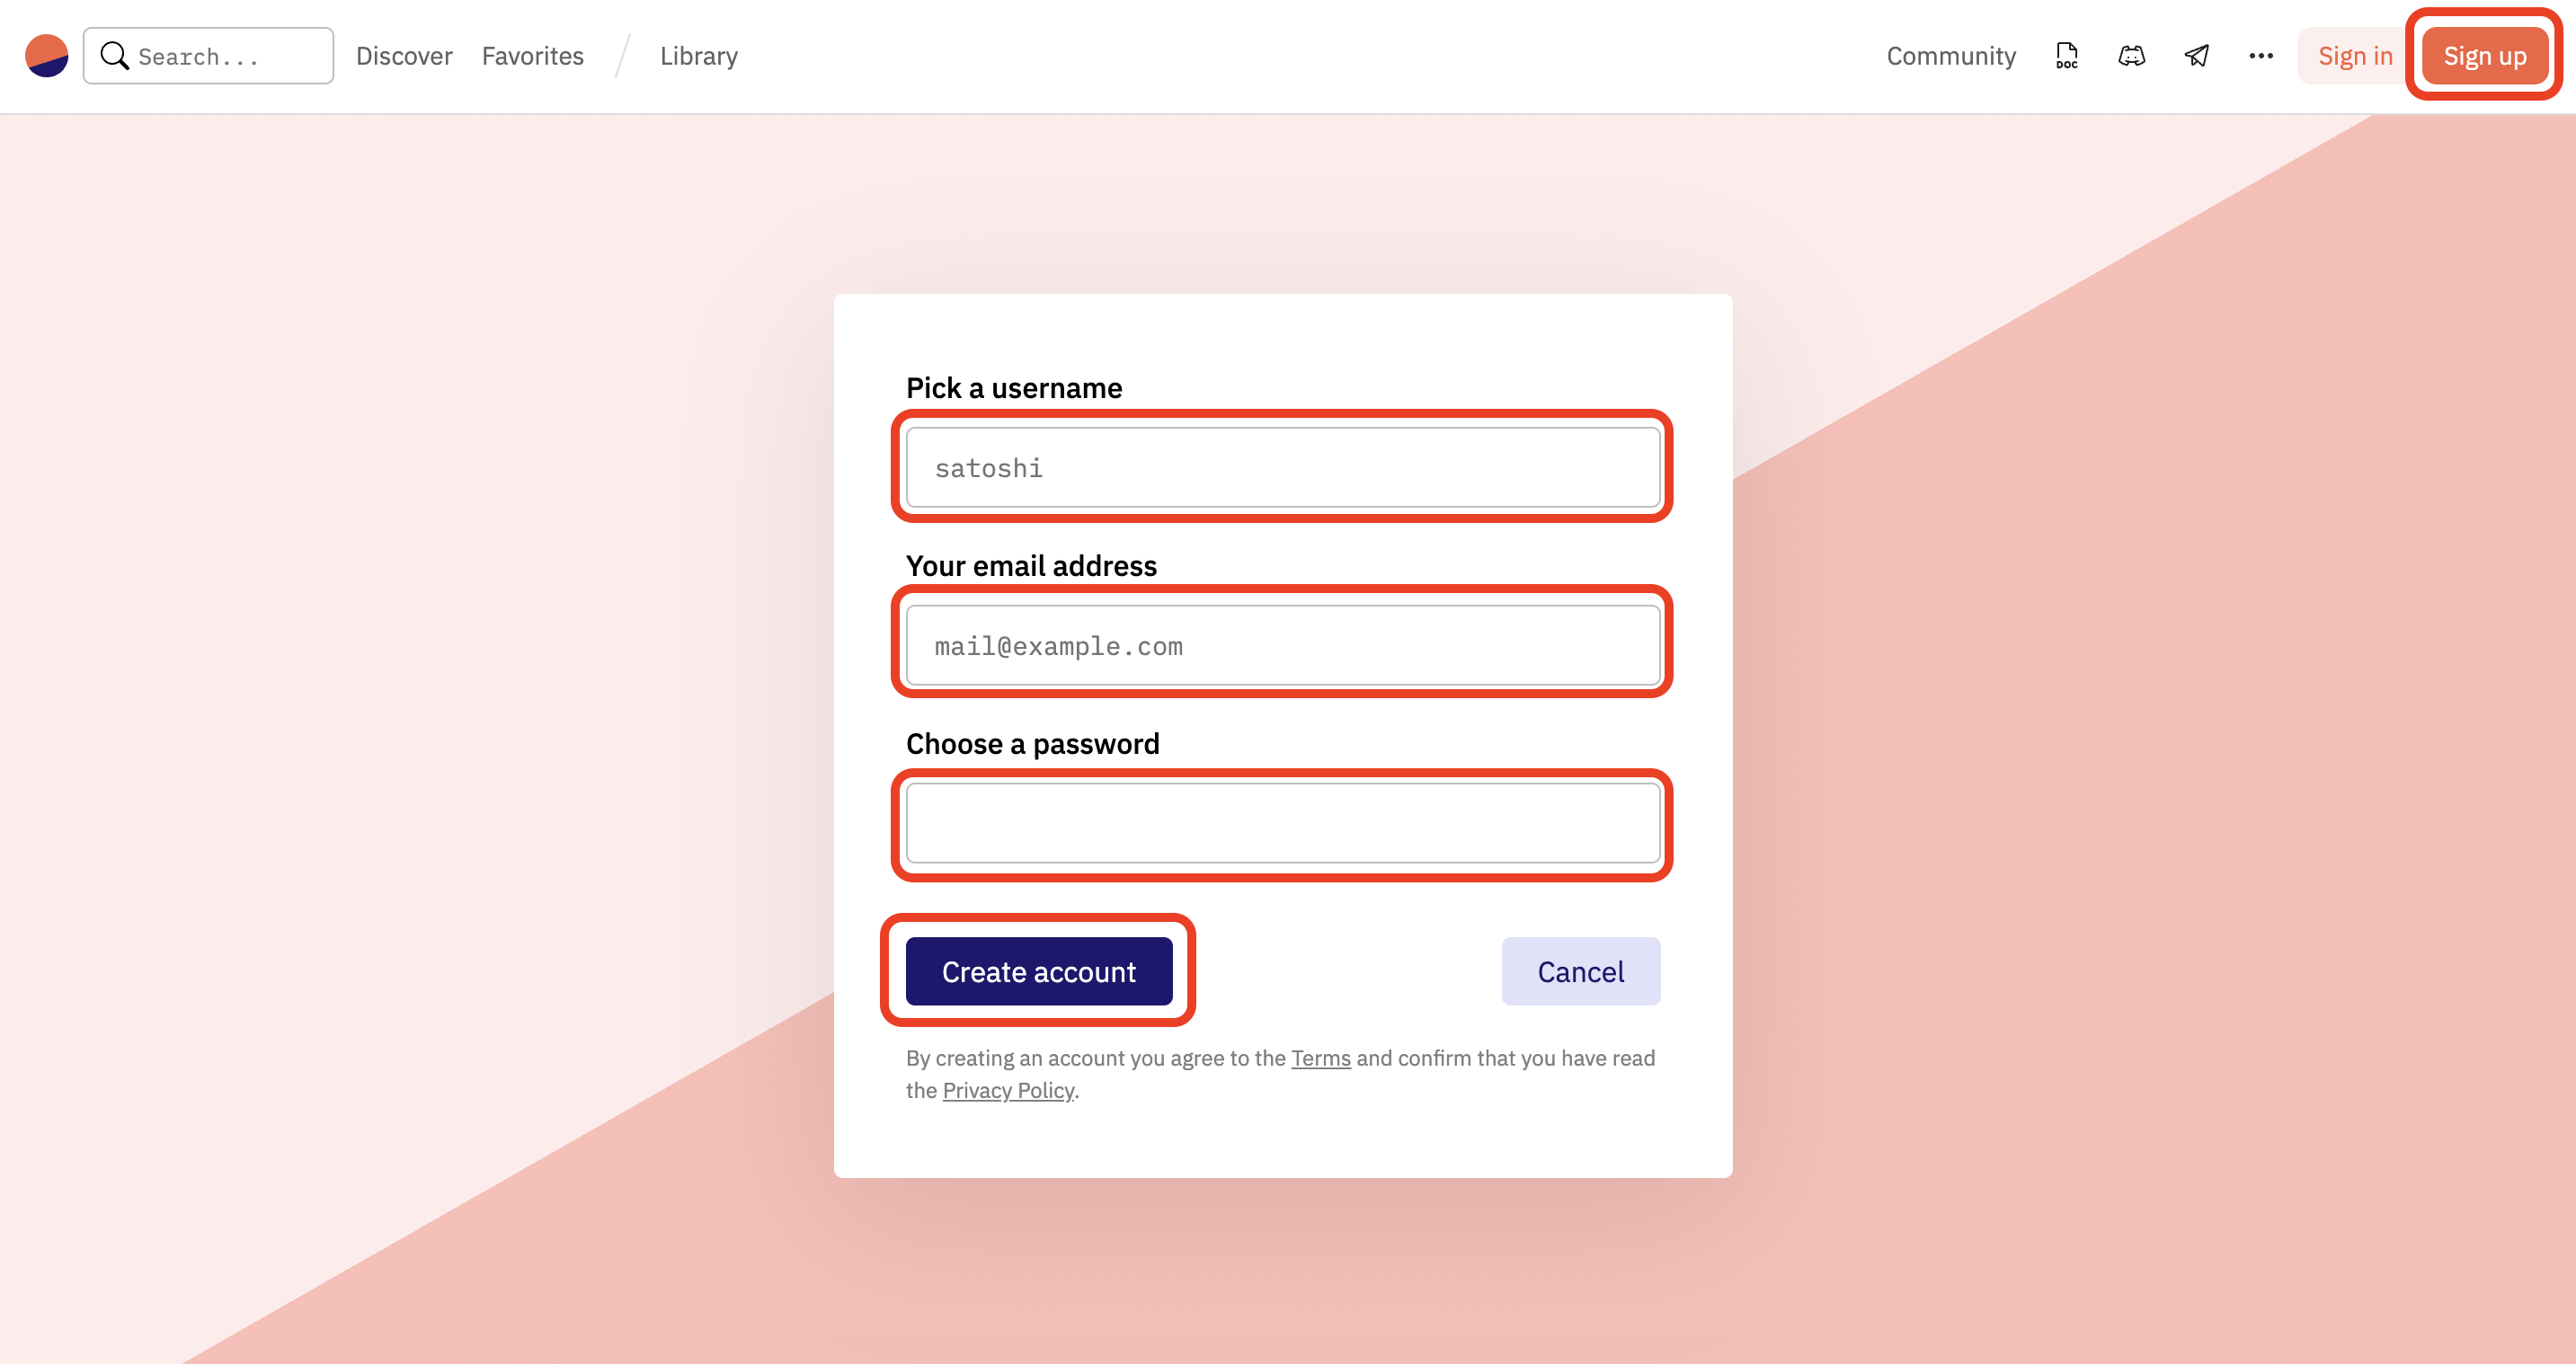
必要な情報を入力し、「Create account」をクリックしてください。
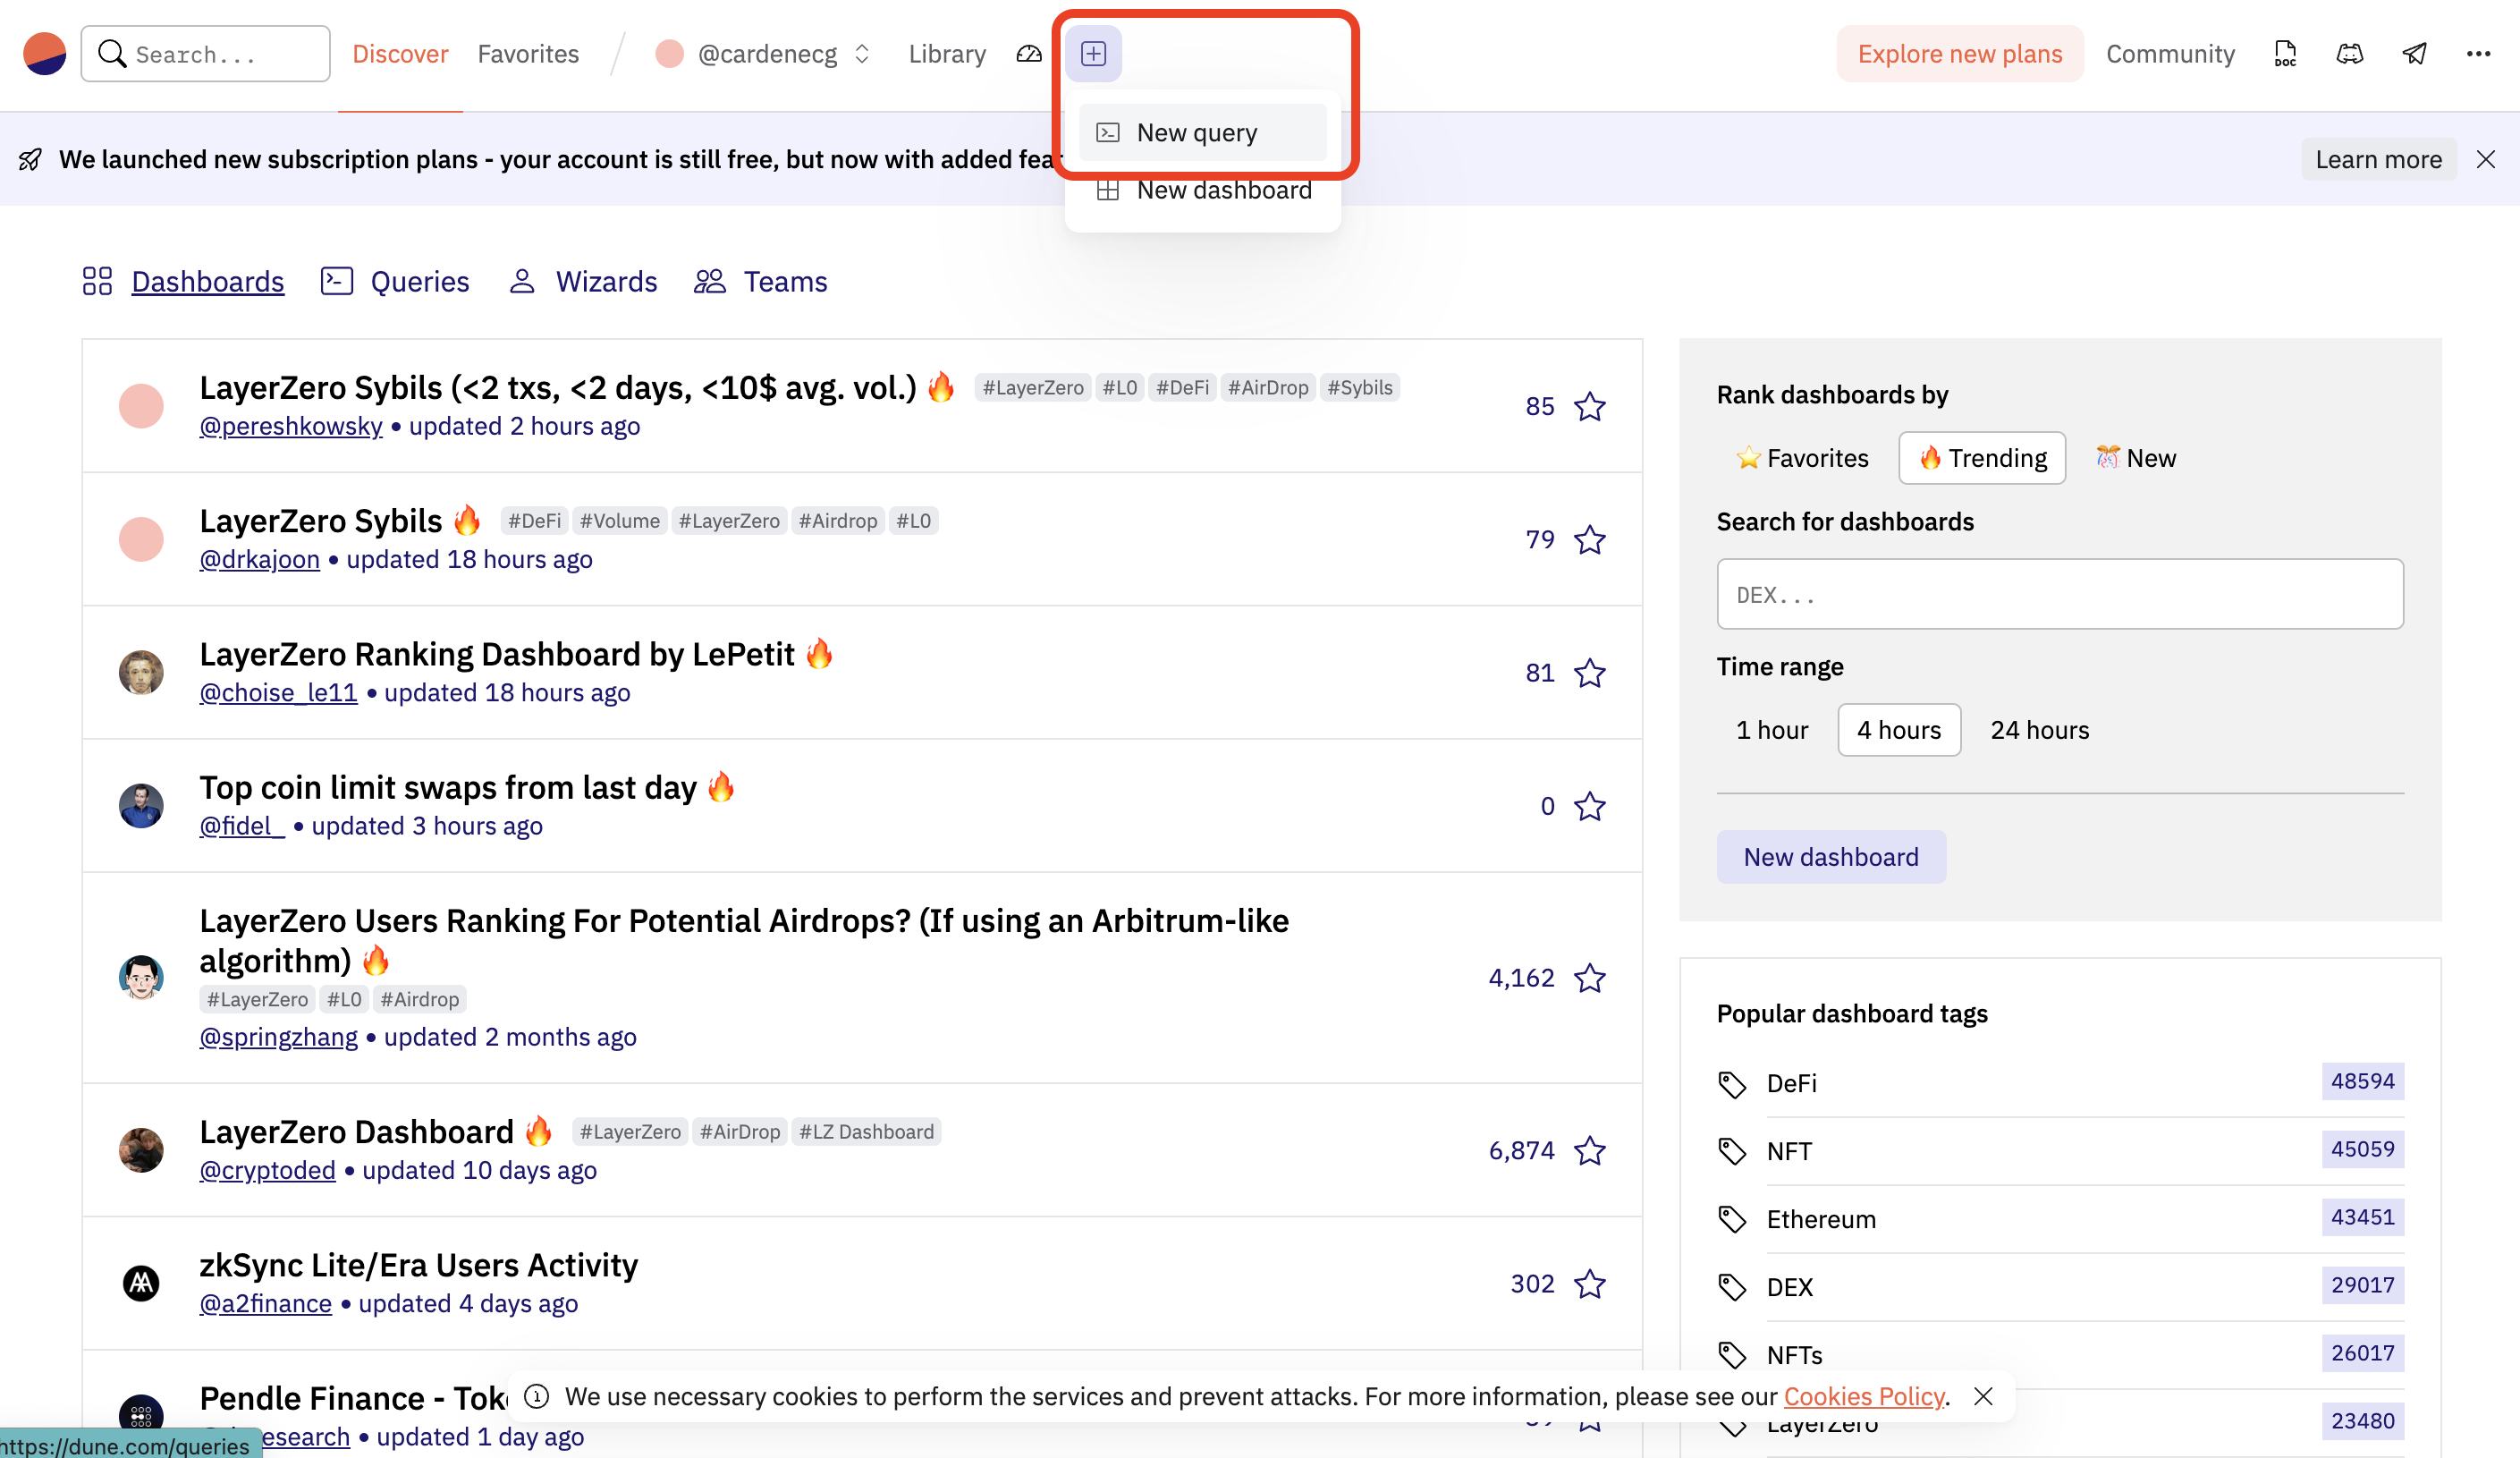
ログインできたら、上記の画面上にある「+」ボタンを押して「New query」をクリックしてください。
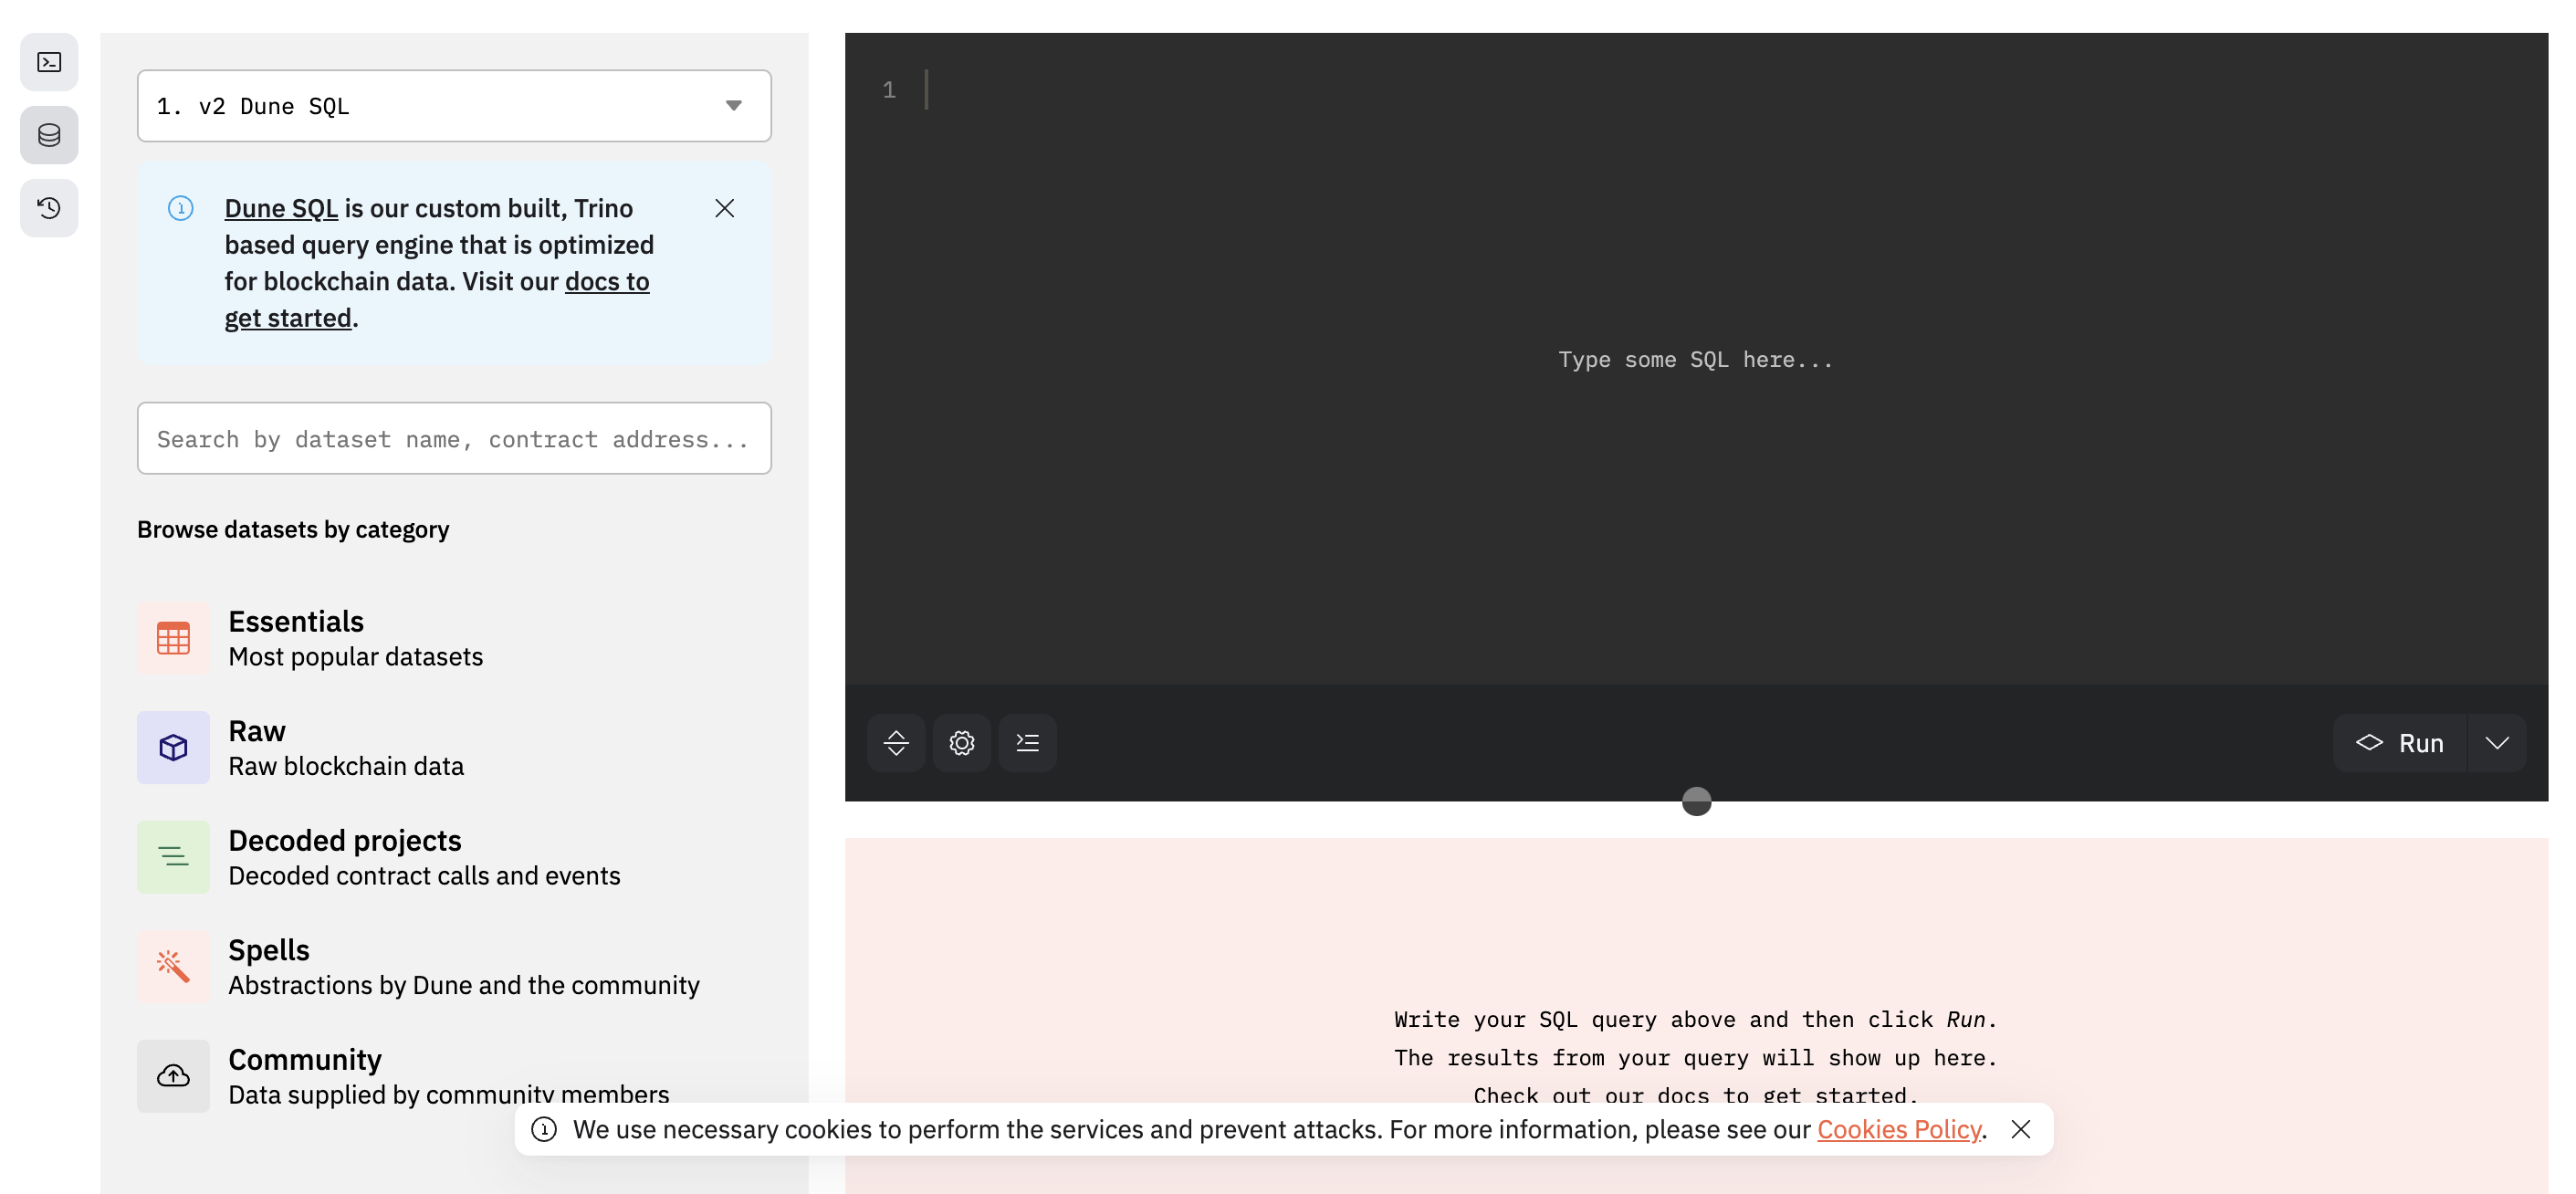
そうすると上記のような画面が出てきます。
これで準備は完了です。
実行
では早速クエリの実行をしていきましょう。
今回は弊社が運営・開発しているブロックチェーンゲームである、「Crypto Spells」のNFTの取引データを取得するクエリを用意しました。
select
  *
FROM
  nft.trades
where
  nft_contract_address = 0x67cBBb366a51FFf9ad869d027E496Ba49f5f6D55
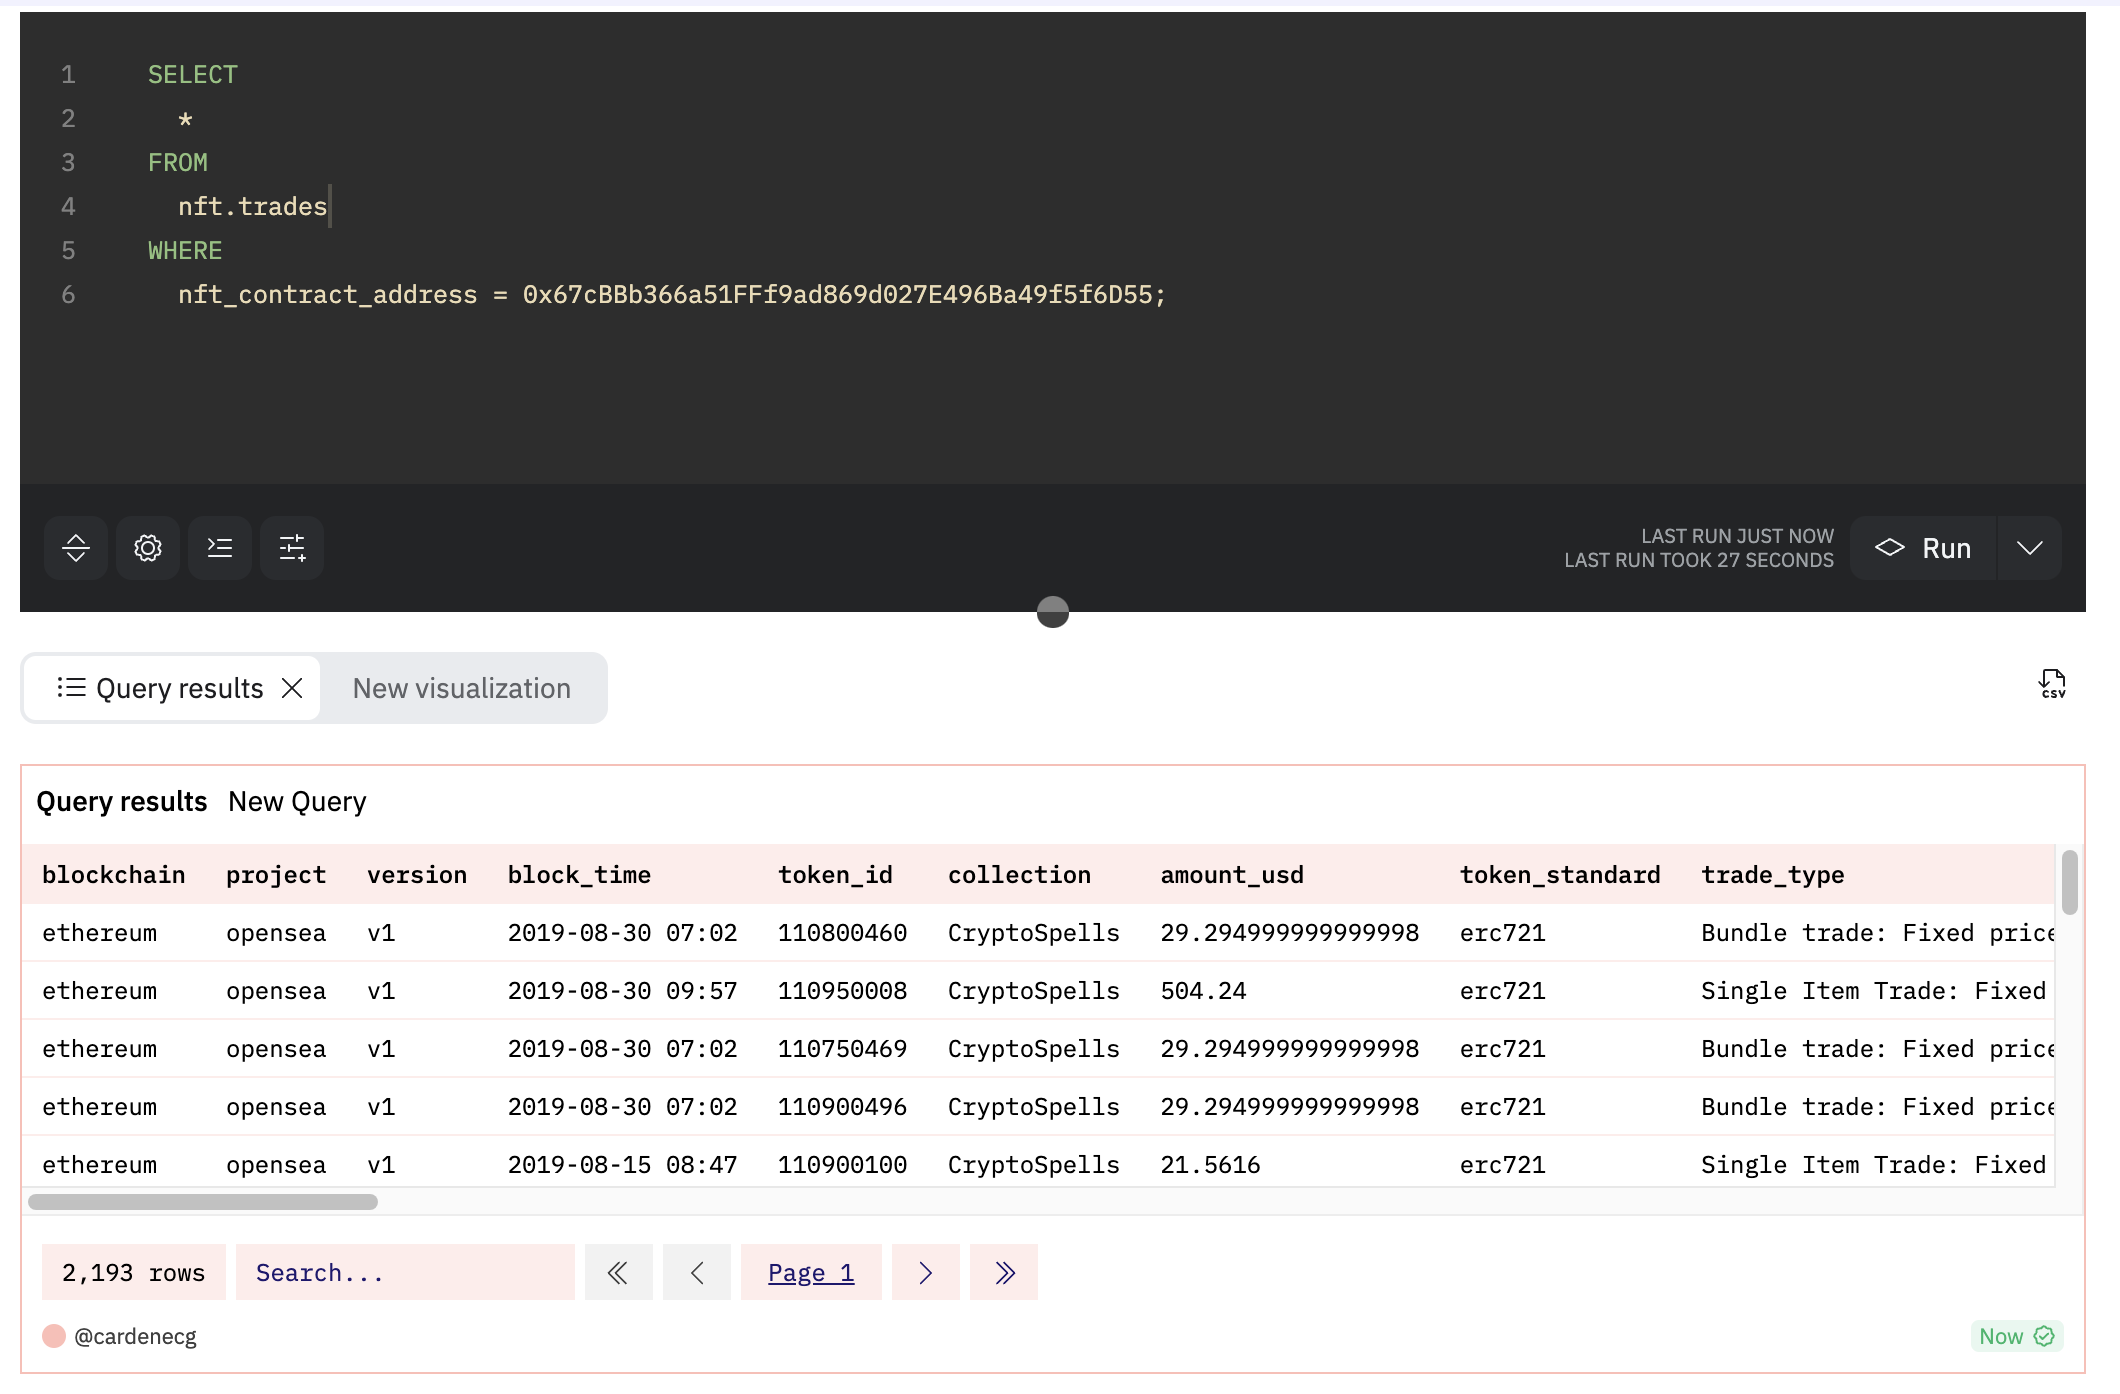
上記のクエリを下記の赤枠で囲われた黒い部分に貼り付けてください。
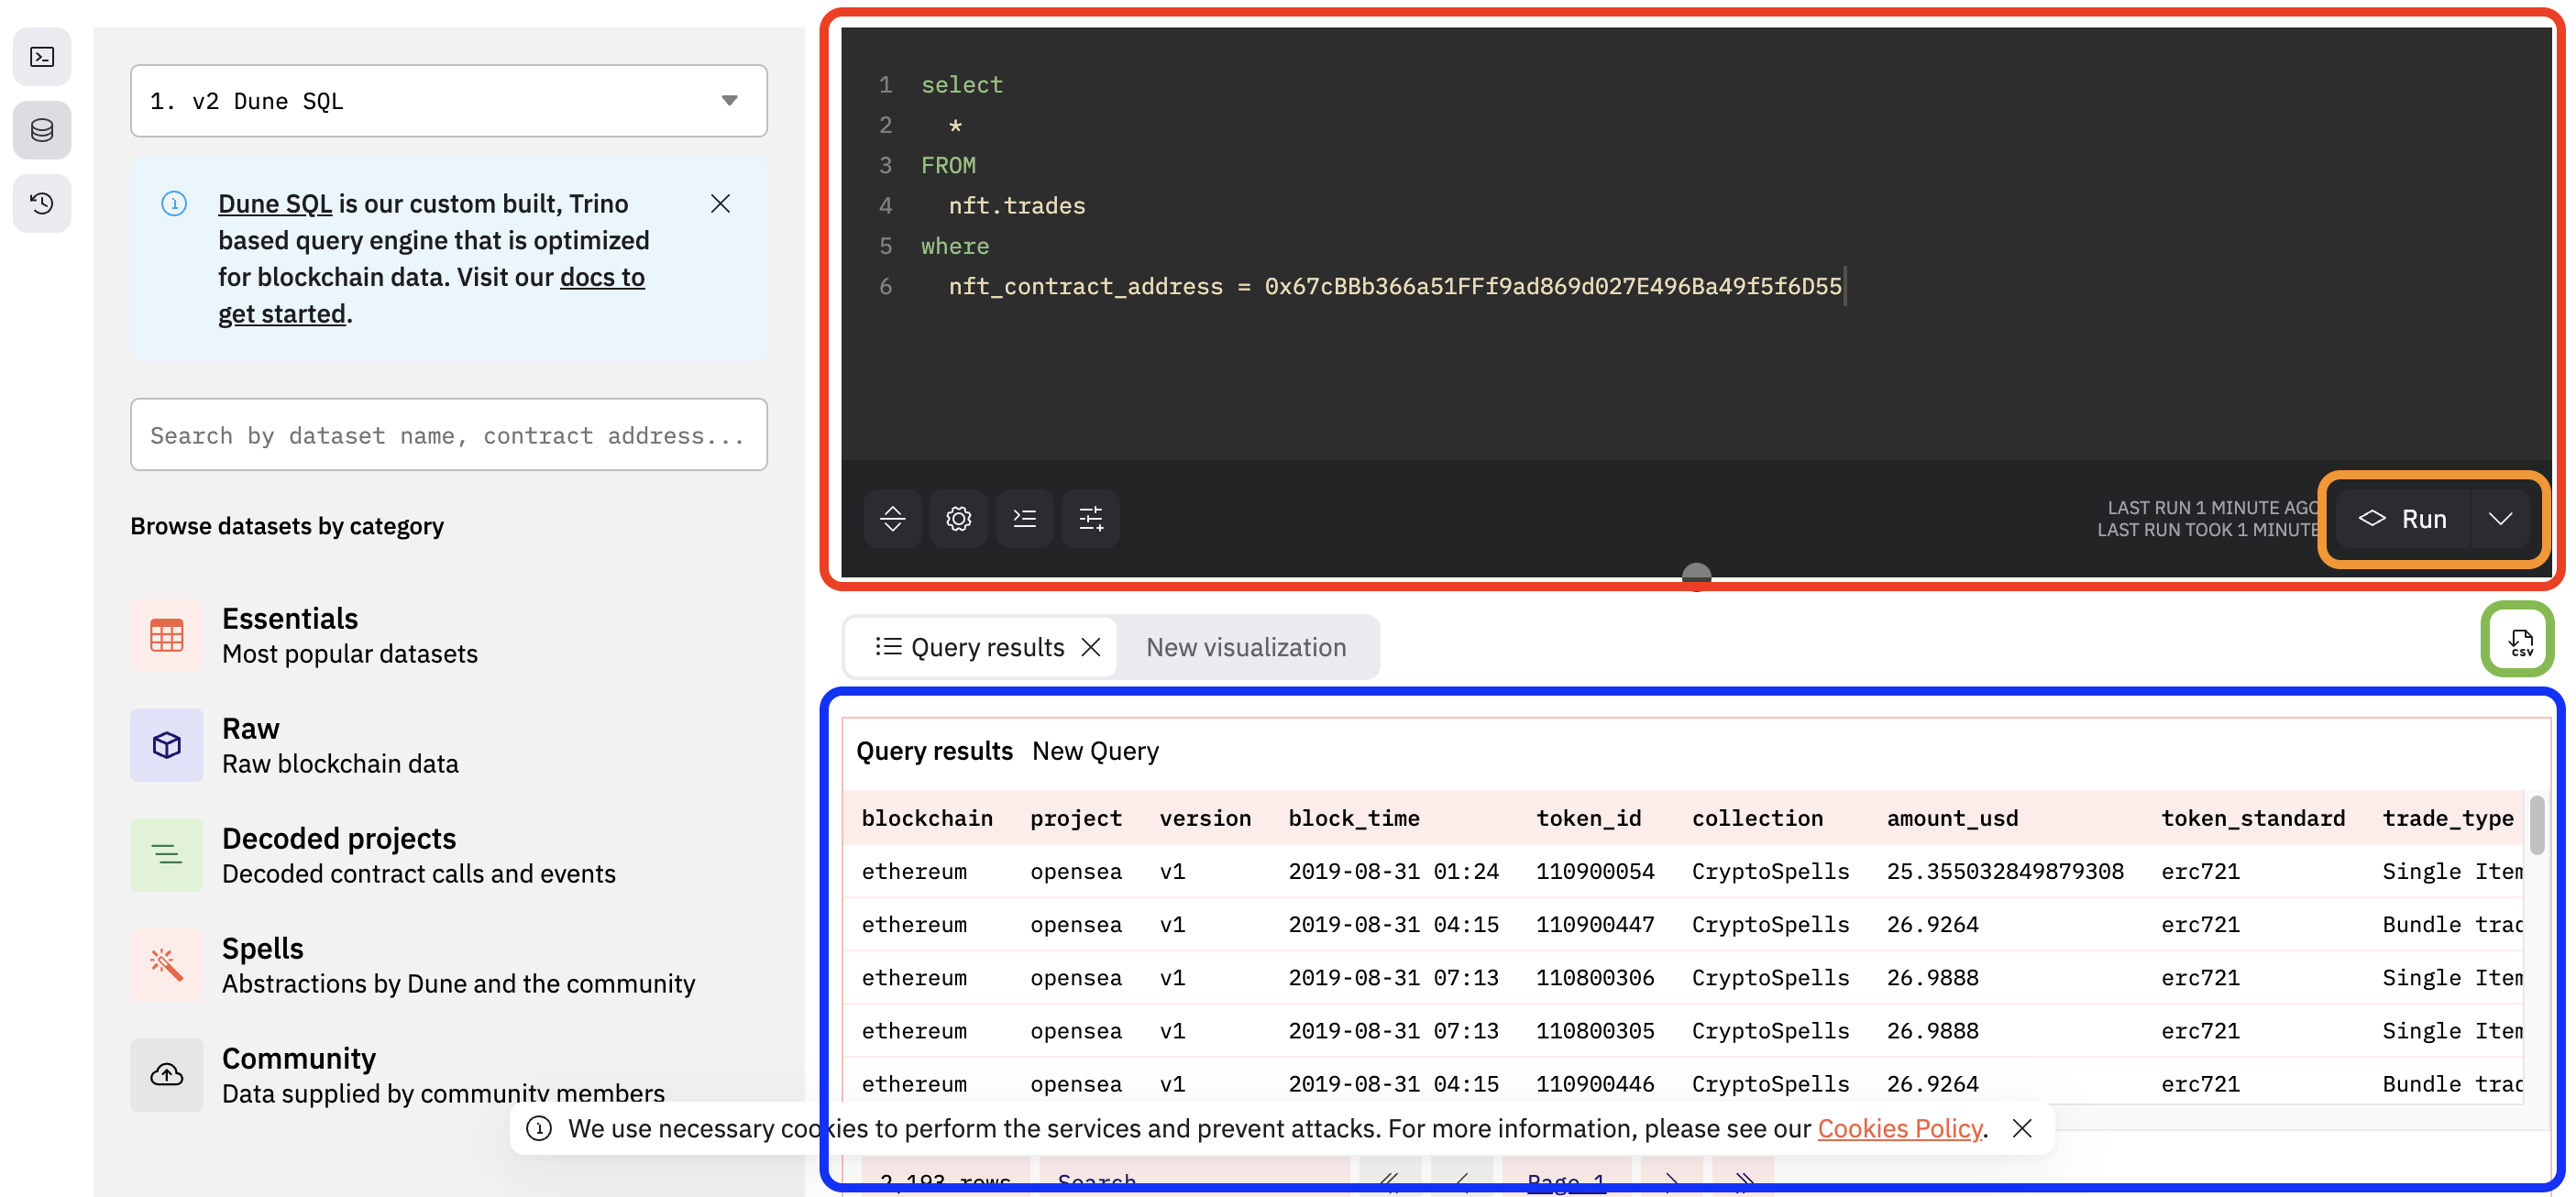
貼り付けられたらオレンジ枠の「Run」をクリックしてください。
30秒くらいすると青枠部分に出力結果が表示されます。
最後に緑枠部分のボタンをクリックして、CSV出力をしてみましょう(色がたくさんあって申し訳ないです...)。
これでデータの用意は完了です!
では次の章で実際に「Code Interpreter」を使用してデータの分析をしてみましょう!
Code Interpreterで分析
では早速「Code Interpreter」を使用してデータを分析したり、グラフ表示してみましょう!
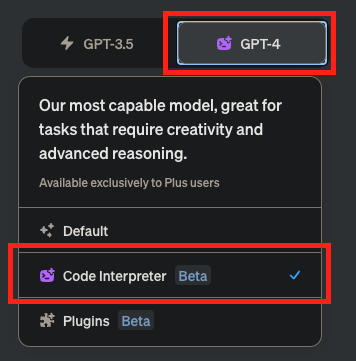
まずはChatGPTを開いて上記の画像のように「Code Interpreter」を使用する準備をしてください。
表の作成
まずは表を作成していきます。
以下のテキストをChatGPTに投げ込んでください。
Block chainゲーム内のNFTである「Crypto Spells」の取引データです。
このデータの「1日の取引量」、「時間帯による取引量」、「曜日による取引量」、「高額取引される時間帯」、「高額取引される曜日」、「高額取引されている日毎のデータ」を出してください。
This is the transaction data for Crypto Spells, an NFT in the Block chain game.
Please give me the "daily trading volume", "trading volume by time of day", "trading volume by day of the week", "time of day when high prices are traded", "day of week when high prices are traded", and "data for each day when high prices are traded" for this data.
出力結果
It appears that there isn't a 'timestamp' column in the data. In order to provide the information you're asking for, we'll need a timestamp for each transaction. Let's look at the column names in the dataset to identify the right one.
The 'block_time' column appears to be the right one for our purposes, as it likely represents the time each transaction was made on the blockchain. Let's convert this column to datetime format and proceed with the analysis.
The data has been loaded successfully and the 'block_time' column has been converted to datetime format. Now, let's proceed with your requests.
- Daily trading volume
- Trading volume by time of day
- Trading volume by day of the week
- Time of day when high prices are traded
- Day of the week when high prices are traded
- Data for each day when high prices are traded
We can calculate the trading volume by summing the 'amount_usd' column. High prices can be defined as prices above a certain percentile, for example, the 95th percentile.
Let's start with the daily trading volume.
The daily trading volume of Crypto Spells is as follows:
(Note: The dates are in UTC.)
Date                     Daily Trading Volume (USD)
2019-07-22 00:00:00+00:00     317.812
2019-07-23 00:00:00+00:00     185.166
2019-07-24 00:00:00+00:00     428.393
2019-07-25 00:00:00+00:00     136.793
2019-07-26 00:00:00+00:00     151.186
...
2023-03-02 00:00:00+00:00       0.000
2023-03-03 00:00:00+00:00       0.000
2023-03-04 00:00:00+00:00       0.000
2023-03-05 00:00:00+00:00       0.000
2023-03-06 00:00:00+00:00    2022.310
Please note that the daily trading volume is the sum of the 'amount_usd' column for each day, and the dates are shown in UTC timezone.
Let's now calculate the trading volume by time of day.
The trading volume by time of day (UTC) is as follows:
Hour of Day (UTC)  Trading Volume (USD)
0                    7279.47
1                   18839.87
2                   14098.29
3                   32830.58
4                   30887.26
5                    6311.93
6                   10741.55
7                   12480.51
8                   28290.60
9                   17807.53
10                  24638.26
11                  19830.60
12                  22674.81
13                  16133.86
14                  14193.62
15                  16090.11
16                   2998.62
17                   2555.36
18                    724.34
19                    512.76
20                    500.37
21                  10991.49
22                   5447.27
23                   7654.76
Please note that the time of day is in 24-hour format and is given in UTC. The trading volume is the sum of the 'amount_usd' column for each hour of the day.
Next, let's calculate the trading volume by day of the week.
The trading volume by day of the week (UTC) is as follows:
Day of the Week   Trading Volume (USD)
Monday (0)              56962.54
Tuesday (1)             54042.68
Wednesday (2)           46192.10
Thursday (3)            37257.62
Friday (4)              37950.83
Saturday (5)            44206.30
Sunday (6)              47901.73
Please note that the day of the week is represented with Monday as 0 and Sunday as 6. The trading volume is the sum of the 'amount_usd' column for each day of the week.
Next, let's identify the time of day when high prices are traded. As mentioned before, we can define high prices as prices above a certain percentile, for example, the 95th percentile.
The time of day (UTC) when high prices are traded is as follows:
Hour of Day (UTC)  Number of High Price Trades
0                           4
1                           7
2                           7
3                          12
4                           9
5                           1
6                           3
7                           5
8                           9
9                           4
10                          8
11                         11
12                          9
13                          5
14                          3
15                          4
16                          1
17                          1
21                          2
22                          2
23                          3
High prices are defined as prices above the 95th percentile. The time of day is in 24-hour format and is given in UTC.
Next, let's identify the day of the week when high prices are traded.
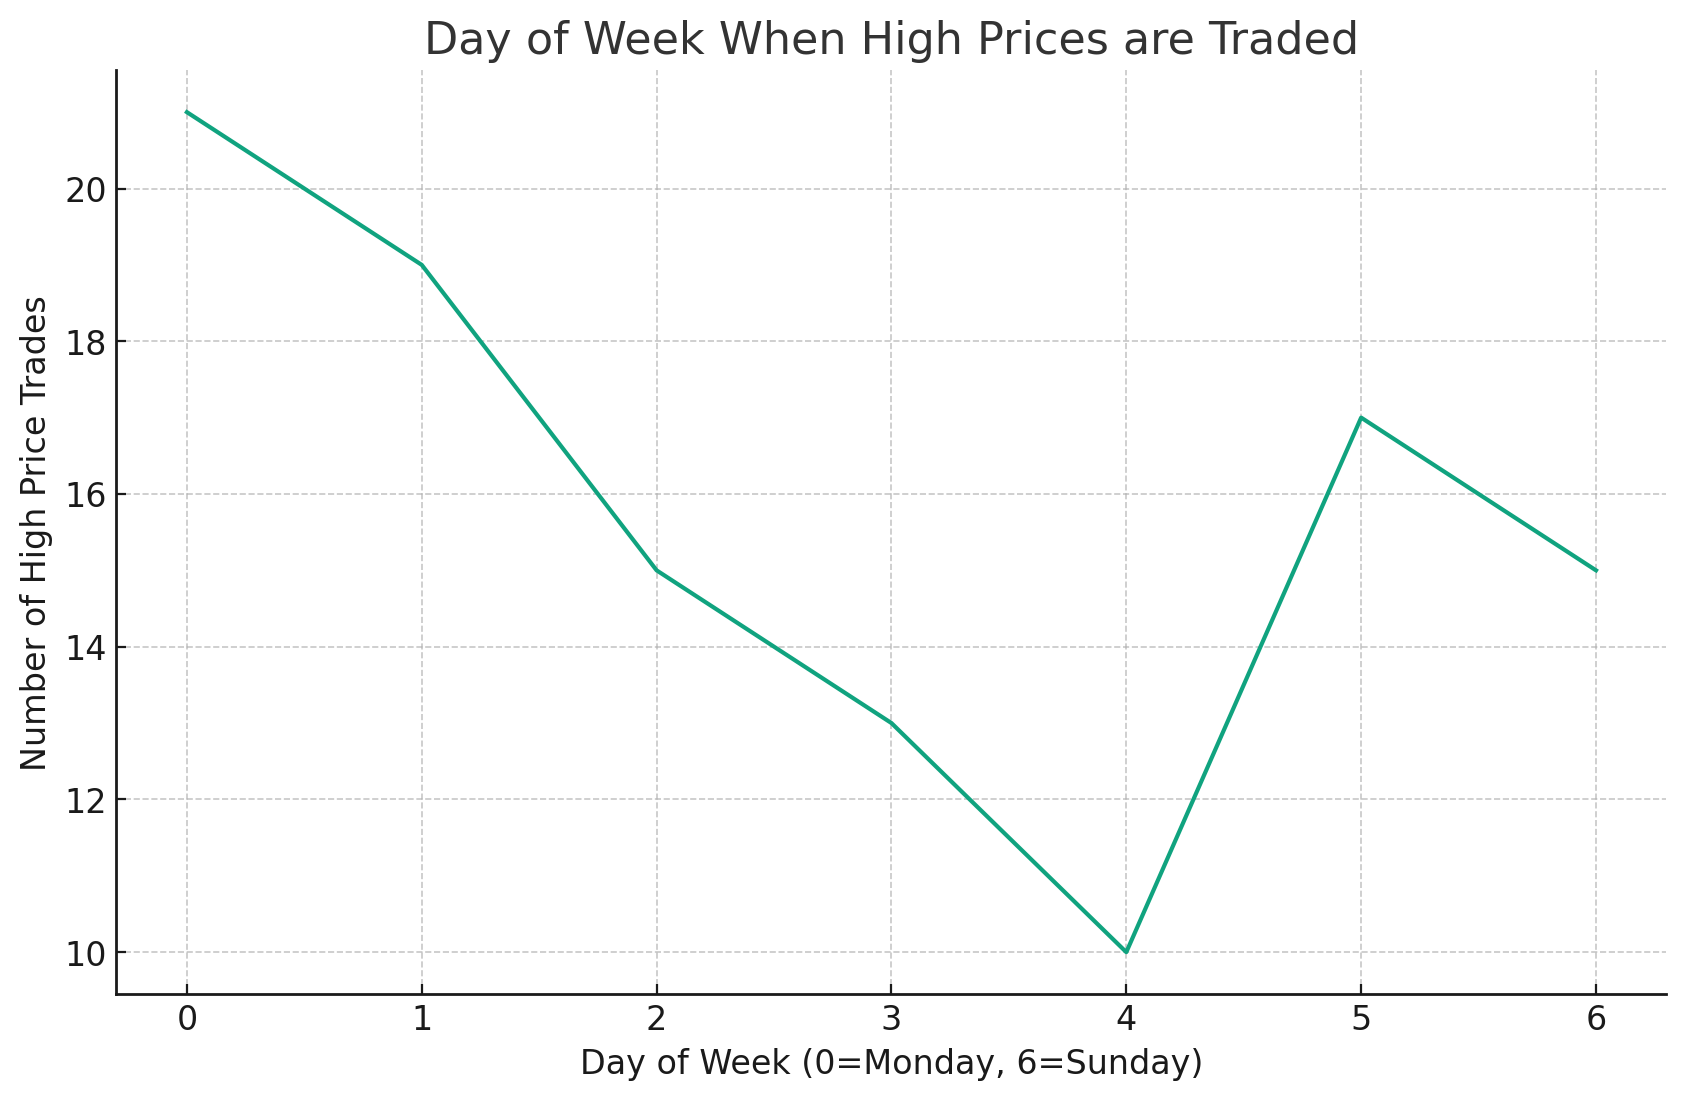
The day of the week when high prices are traded is as follows:
Day of the Week   Number of High Price Trades
Monday (0)                     21
Tuesday (1)                    19
Wednesday (2)                  15
Thursday (3)                   13
Friday (4)                     10
Saturday (5)                   17
Sunday (6)                     15
Please note that the day of the week is represented with Monday as 0 and Sunday as 6.
Finally, let's get the data for each day when high prices are traded.
The data for each day when high prices are traded is as follows:
Date                     Token ID   Amount (USD)   Number of Items   Amount Original   Amount Raw   Block Number
2019-07-29 00:00:00+00:00  110950004  1037.362           1              4.103           4.103e+18   8243788
2019-08-05 00:00:00+00:00  110700010  1159.000           1              5.000           5.000e+18   8290506
2019-08-06 00:00:00+00:00  110950009  1147.900           1              5.000           5.000e+18   8296732
2019-08-16 00:00:00+00:00  221900016  1957.515           2             10.500           1.050e+19  16718312
2019-08-19 00:00:00+00:00  110700005  1017.300           1              5.000           5.000e+18   8380034
...
2021-11-10 00:00:00+00:00  113400079  1140.583           1              0.240           2.400e+17  13585893
2022-02-01 00:00:00+00:00  133100006  6866.900           1              2.500           2.500e+18  14118037
2022-08-29 00:00:00+00:00  111000013  2910.840           1              2.000           2.000e+18  15432151
2022-10-16 00:00:00+00:00  111100008  5134.800           1              4.000           4.000e+18  15757486
2023-03-06 00:00:00+00:00  221800570  2022.310           2              1.290           1.290e+18  33538143
High prices are defined as prices above the 95th percentile.
Please note that the dates are shown in UTC timezone, the amount is in USD, the number of items represents the number of transactions made on that day, the amount original represents the original transaction amount in the transaction currency, the amount raw represents the raw transaction amount in the lowest denomination of the transaction currency (for example, Wei for Ethereum), and the block number is the blockchain block number for the transaction.
グラフの作成
次にグラフを出力してみます。
Block chainゲーム内のNFTである「Crypto Spells」の取引データです。
このデータの「1日の取引量」、「時間帯による取引量」、「曜日による取引量」、「高額取引される時間帯」、「高額取引される曜日」、「高額取引されている日毎のデータ」をグラフ出してください。
This is the transaction data for Crypto Spells, the NFT in the Block chain game.
Please graph the "daily trading volume", "trading volume by time of day", "trading volume by day of week", "time of day when high prices are traded", "day of week when high prices are traded", and "data for each day when high prices are traded" for this data.
出力結果
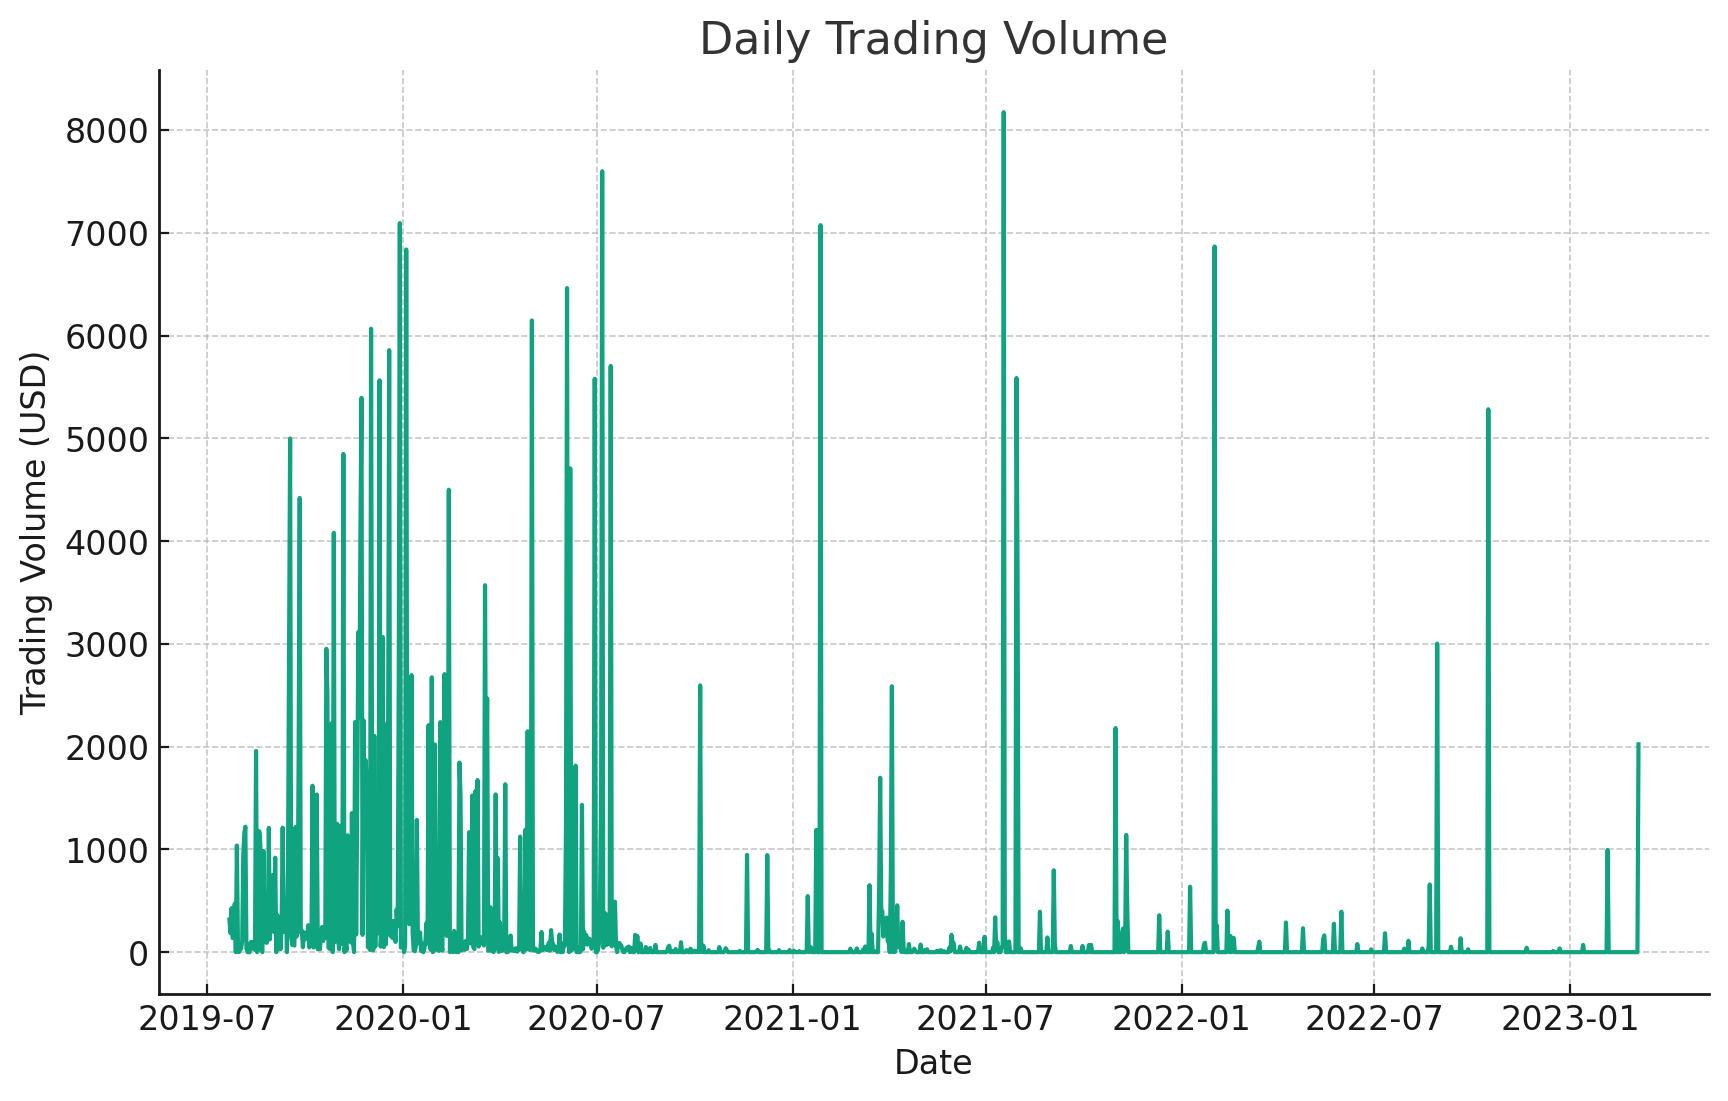
Here are the graphs for the requested metrics:
- Daily Trading Volume: This graph shows the daily trading volume in USD. The x-axis represents the date, and the y-axis represents the trading volume.
-
Trading Volume by Time of Day: This graph shows the trading volume by time of day in UTC. The x-axis represents the hour of the day, and the y-axis represents the trading volume.
-
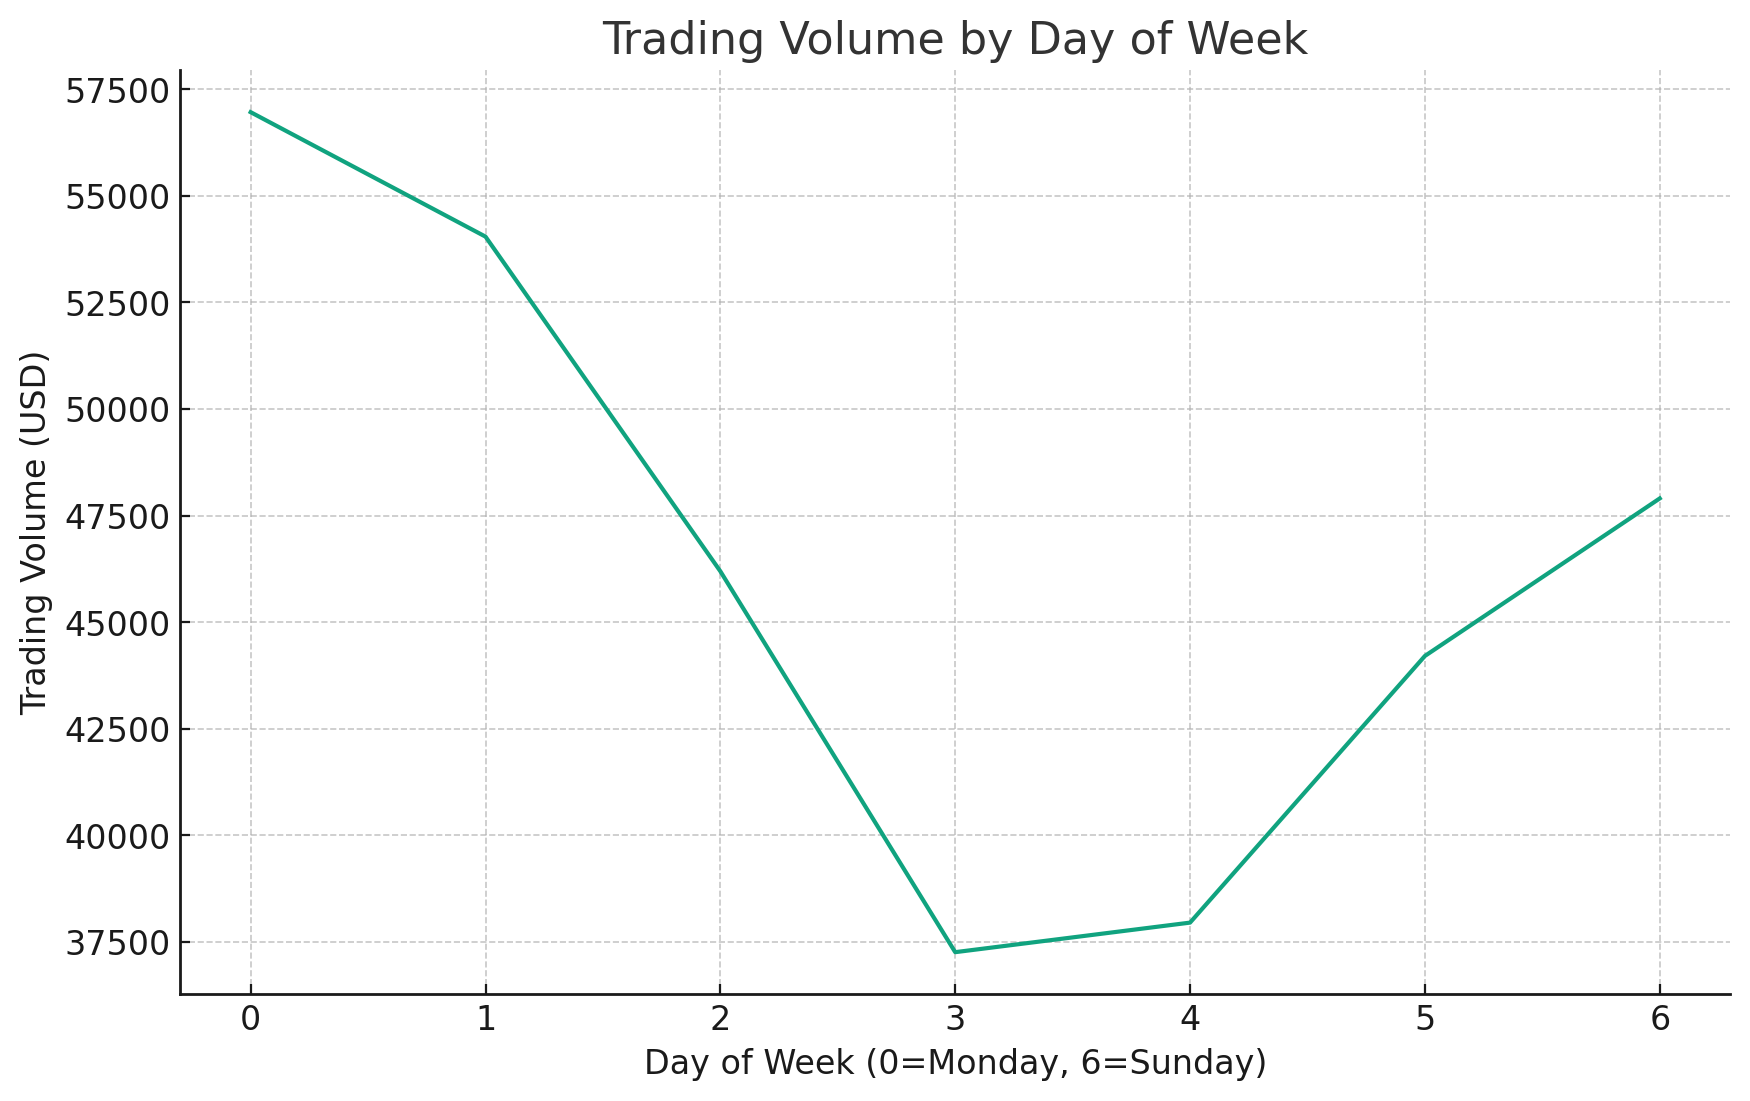
Trading Volume by Day of Week: This graph shows the trading volume by day of the week. The x-axis represents the day of the week with Monday=0 and Sunday=6, and the y-axis represents the trading volume.
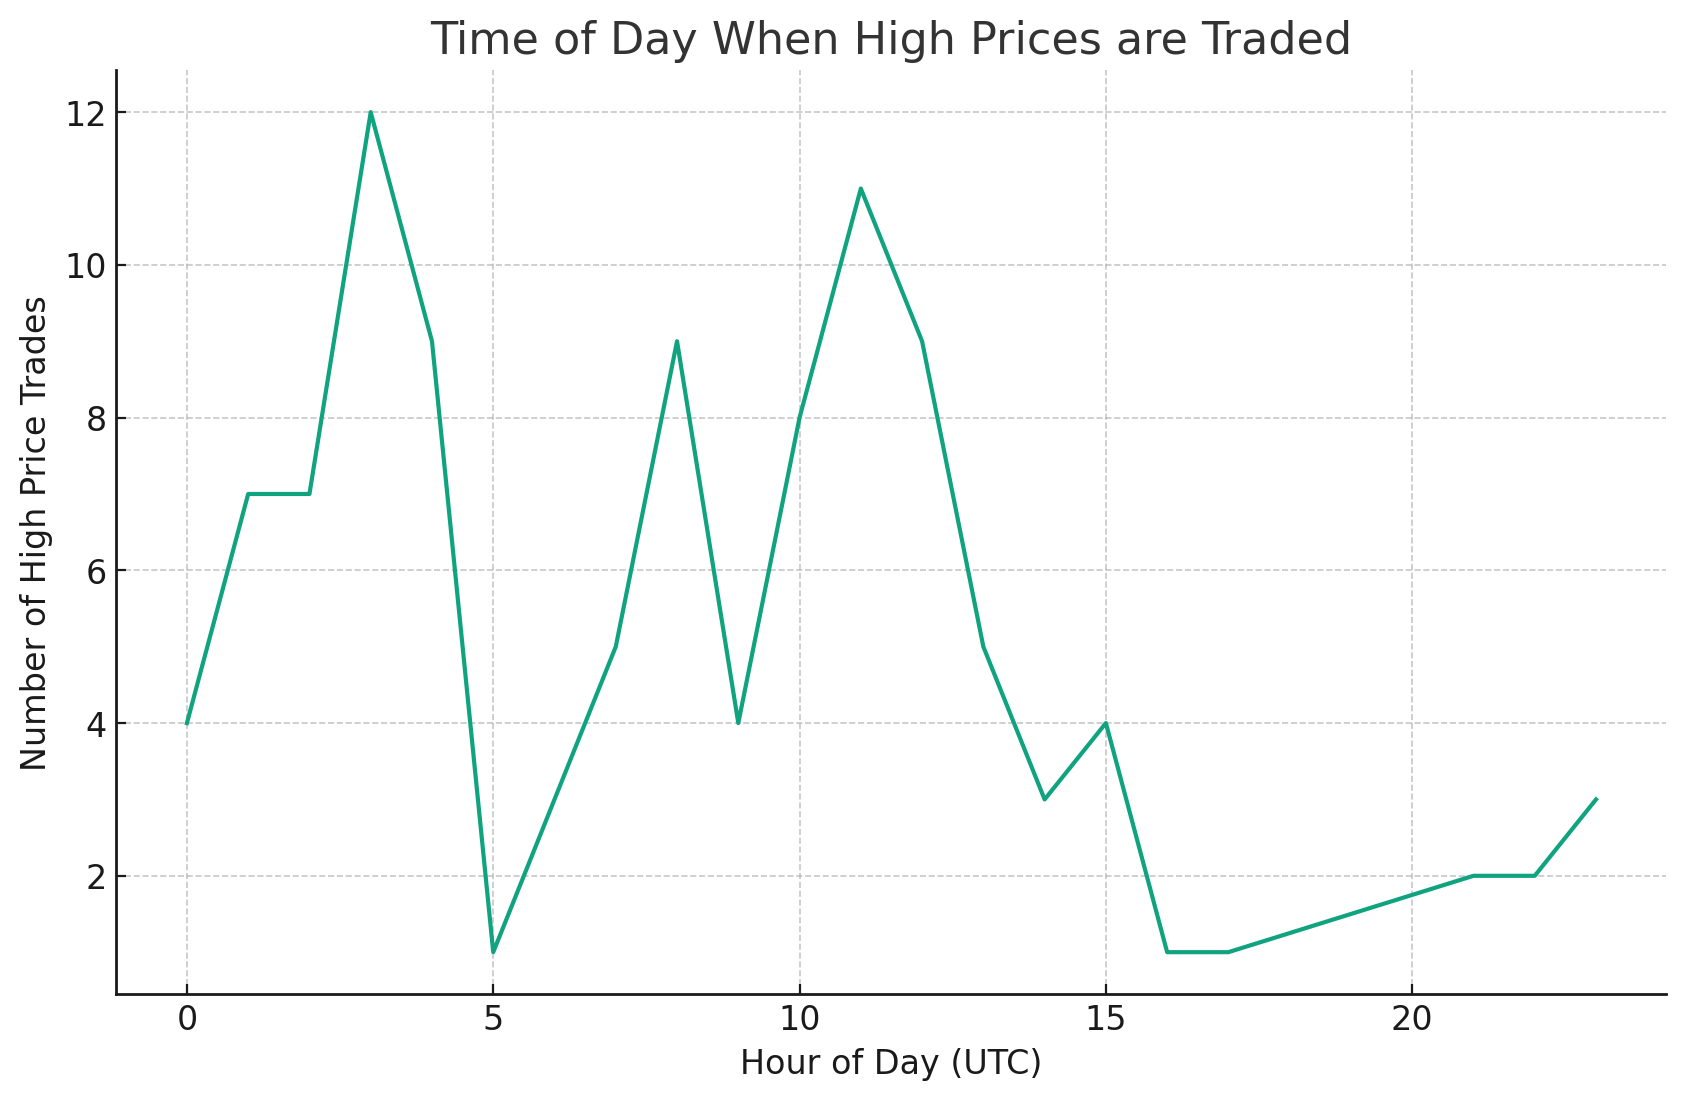
- Time of Day When High Prices are Traded: This graph shows the number of high price trades by time of day in UTC. The x-axis represents the hour of the day, and the y-axis represents the number of high price trades.
- Day of Week When High Prices are Traded: This graph shows the number of high price trades by day of the week. The x-axis represents the day of the week with Monday=0 and Sunday=6, and the y-axis represents the number of high price trades.
- Data for Each Day When High Prices are Traded: This graph shows the trading volume in USD for each day when high prices were traded. The x-axis represents the date, and the y-axis represents the trading volume.
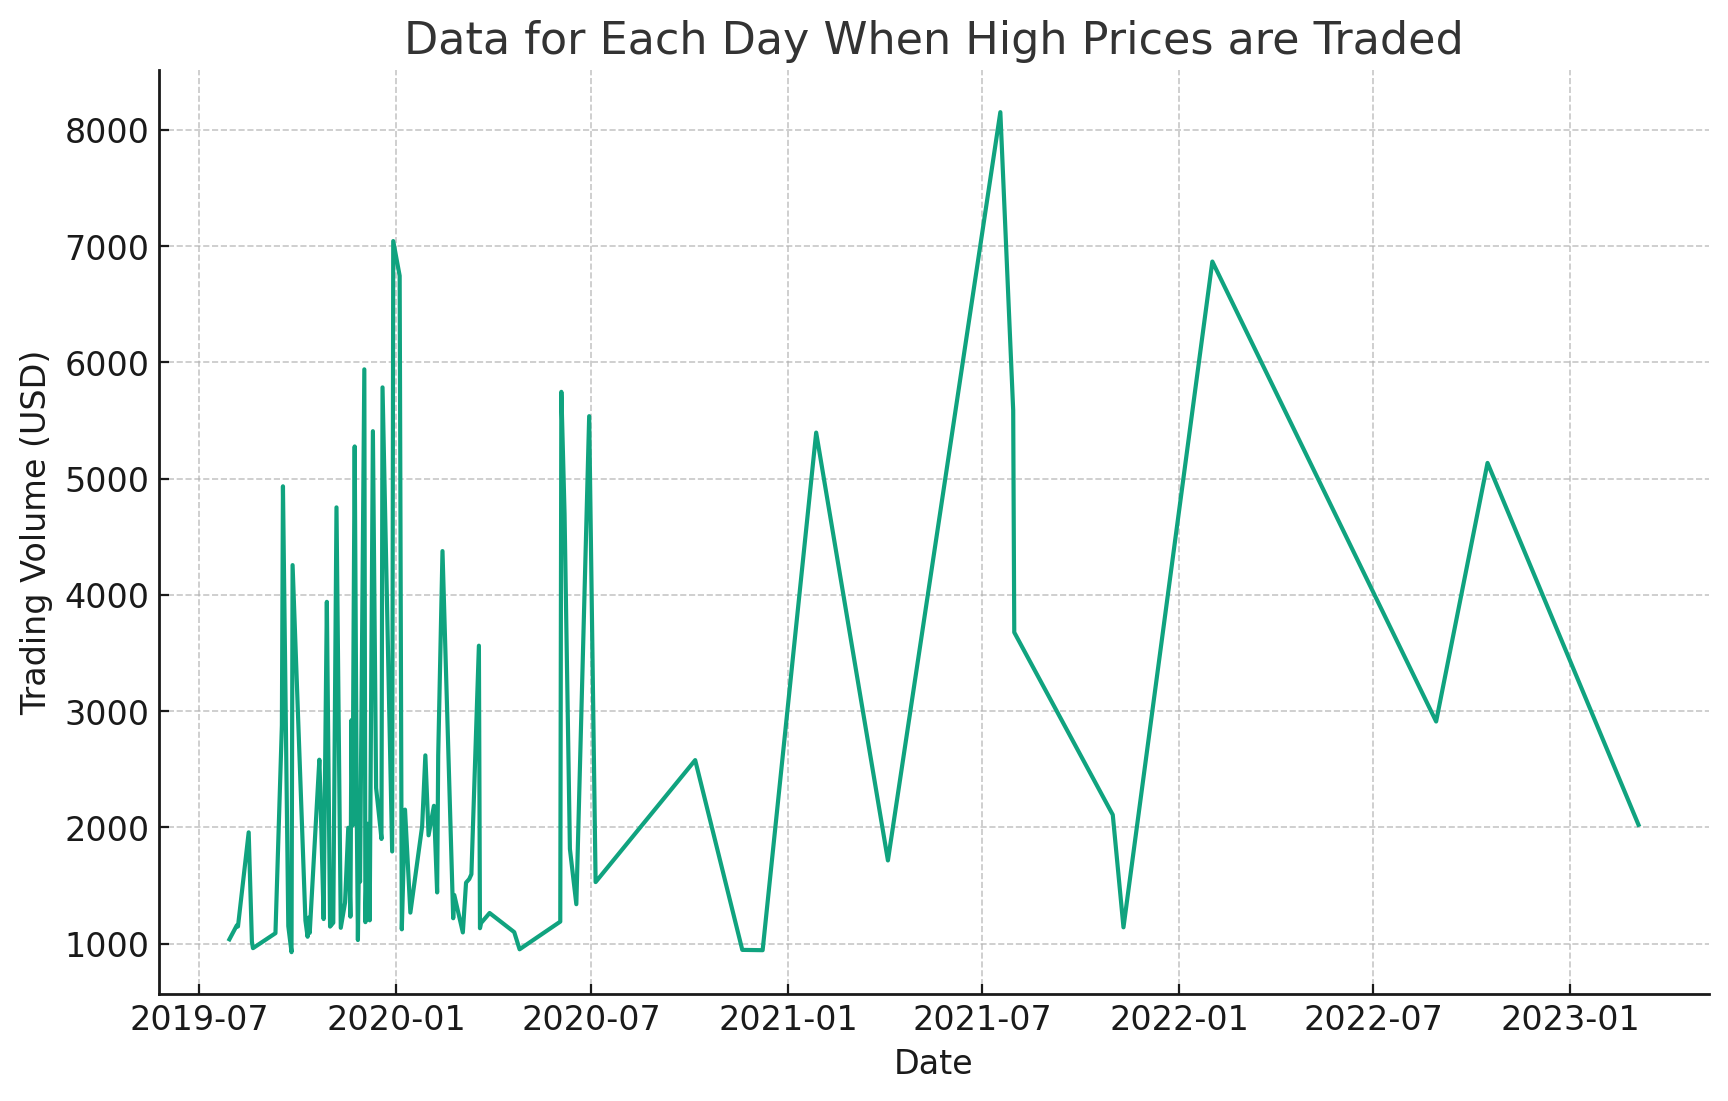
Please note that high prices are defined as prices above the 95th percentile.
いい感じにグラフにしてくれていますね!
さらにデータを出力
さらに追加でデータを出力してみましょう。
Block chainゲーム内のNFTである「Crypto Spells」の取引データです。
以下のデータをグラフで出力してください。
・1日の取引量を1ヶ月単位の軸で表示
・時間帯による取引量
・曜日による取引量
・高額取引される時間帯
・高額取引される曜日
・高額取引されている日毎のデータを1ヶ月単位の軸で表示
高額取引は上位80%のデータと定義します。
また、以下のデータも併せて表示してください。
・高額取引上位5%のアドレスと取引量。
・高額取引上位10%の取引最初の日にち。
出力結果
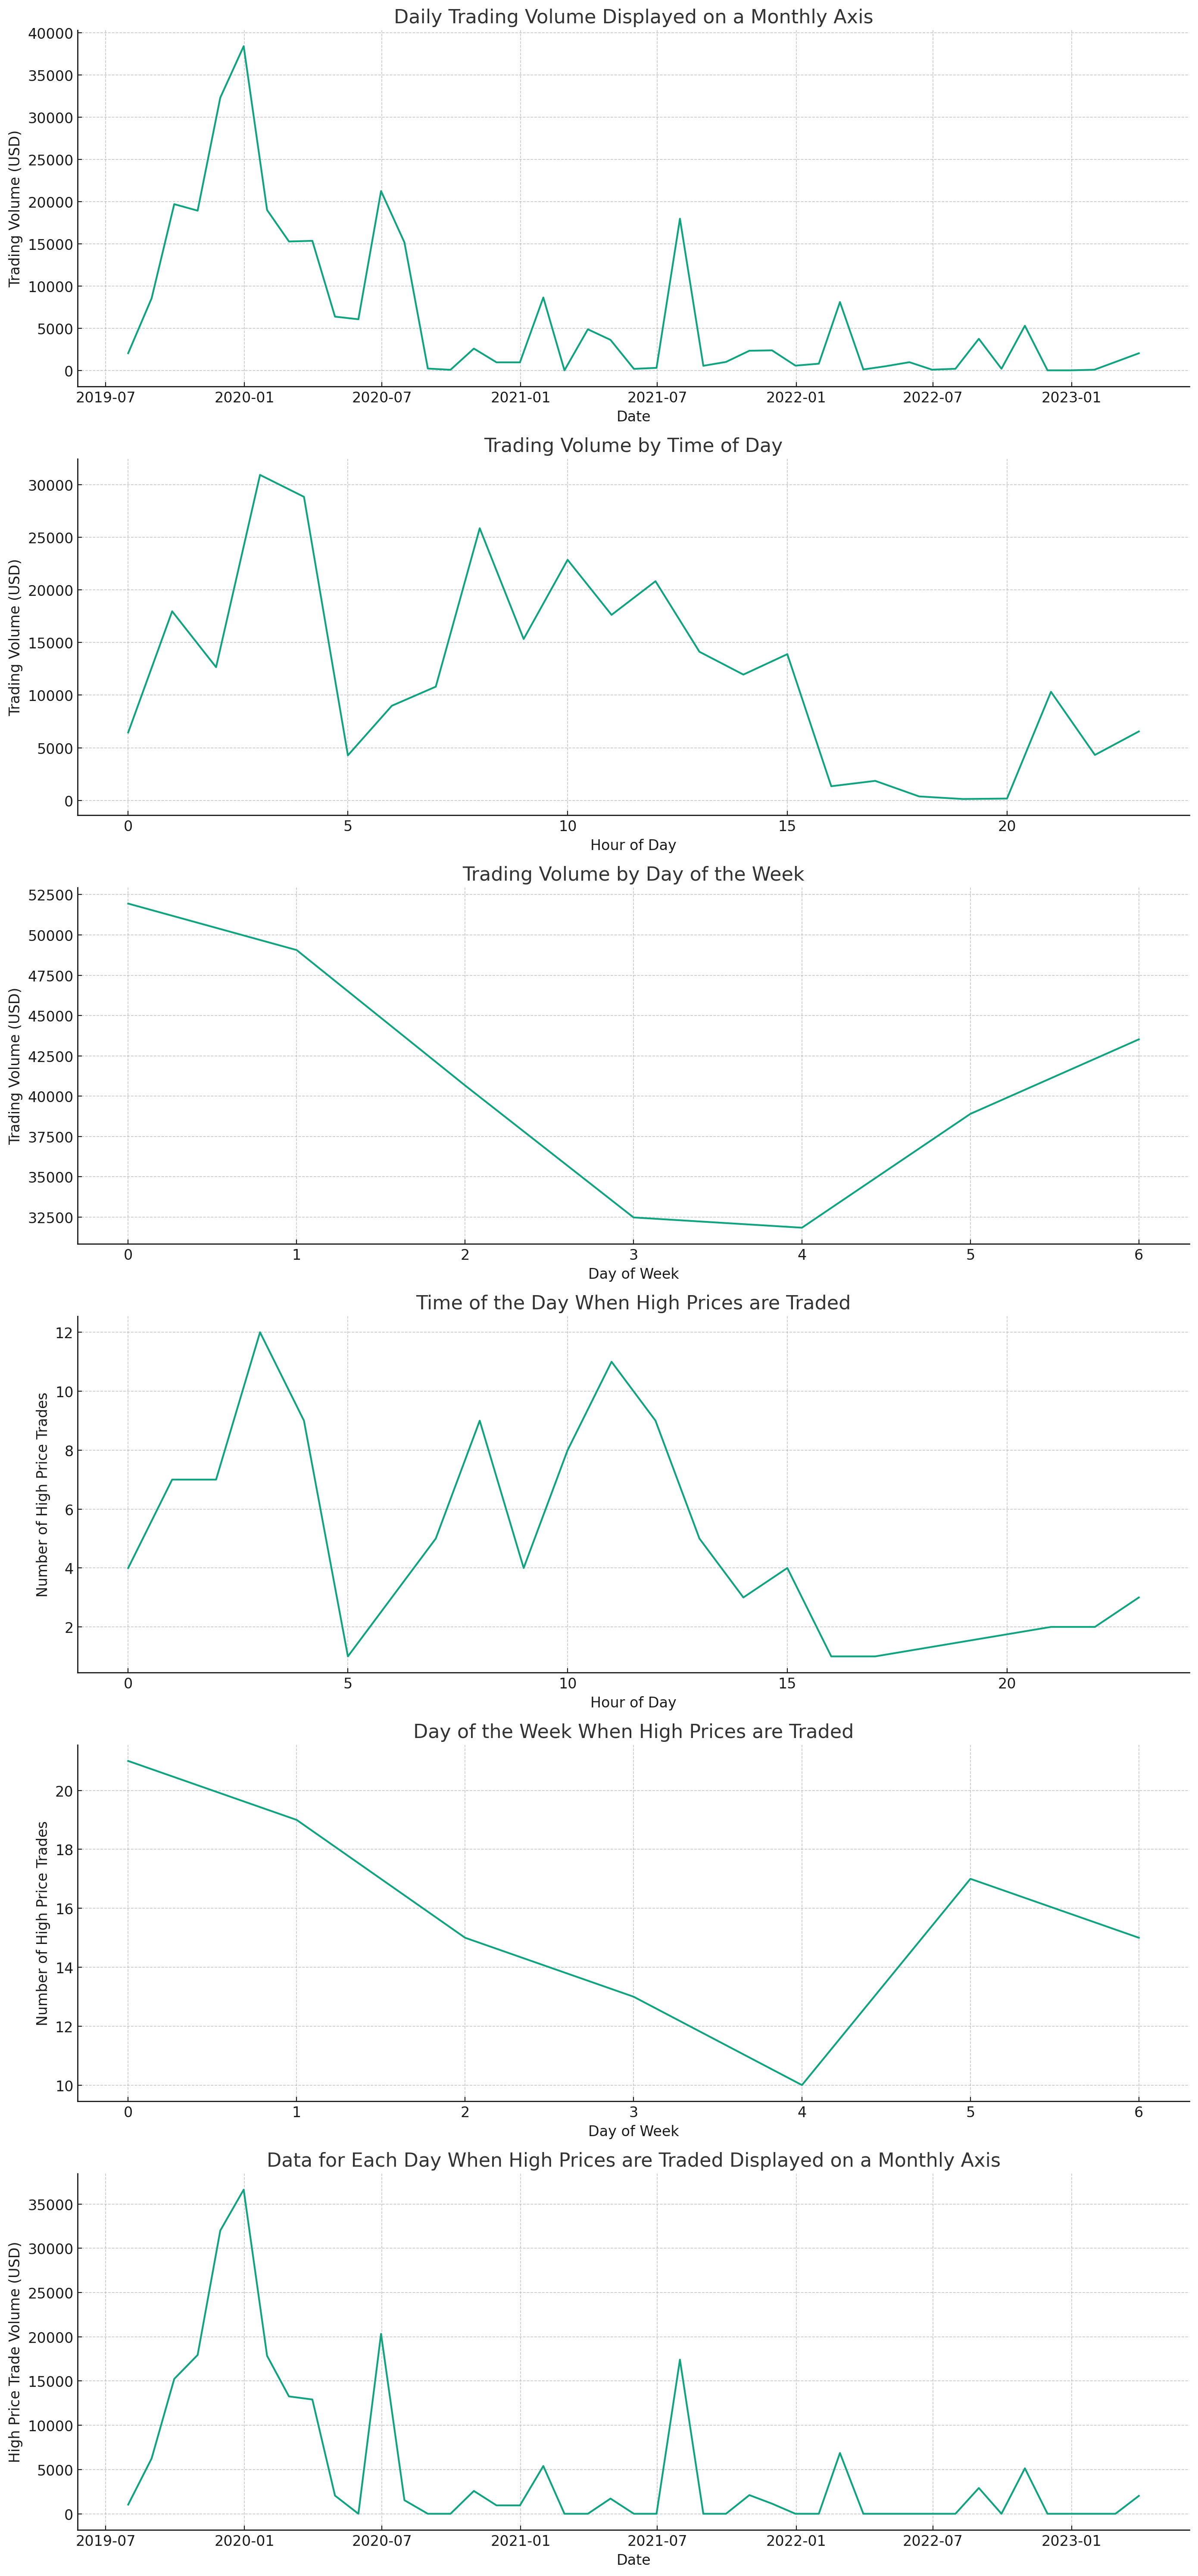
以下は、要求された情報のグラフとデータの概要です:
- 1日の取引量を1ヶ月単位の軸で表示:下の第1グラフを参照してください。
- 時間帯による取引量:下の第2グラフを参照してください。
- 曜日による取引量:下の第3グラフを参照してください。
- 高額取引される時間帯:下の第4グラフを参照してください。
- 高額取引される曜日:下の第5グラフを参照してください。
- 高額取引されている日毎のデータを1ヶ月単位の軸で表示:下の第6グラフを参照してください。
また、「高額取引上位5%のアドレスと取引量」および「高額取引上位10%の取引最初の日にち」についても下記に示します。
高額取引上位5%のアドレスと取引量:
アドレス 取引量(USD)
0x7d238bb0b5b3bf494144fa261d20522f6131b125    13706.963464
0x5df4660295bed7abc783480c7d28d8c015cfb37a    11912.422901
0xaeb92050a7cbe1704c6e299e96712675e21c728d    11573.334000
...
(以下省略)
高額取引上位10%の取引最初の日にち:2019-07-22 14:36:04 UTC
途中でタイムアウトしていますが、データを出力させることができました!
SQL自動生成できない?
ここまでやってみてふと思ったことがあります。
それが「このSQLコマンド自動生成できないのかな?」です。
ざっくり手順としては以下のようなものを想像していました。
- 何かしらドキュメントを「Code Interpreter」に読み込ませる。
- ドキュメントに沿ってコード生成をお願いする。
- 生成されたコードを「Dune Analytics」で実行してみる。
なんだかいけそうな気がしたのでやってみました。
ドキュメントを探す
まずは「Code Interpreter」に読み込ませるドキュメントを探しました。
すぐにドキュメントは見つかりました。
しかし、「Code Interpreter」には1つのファイルしか一度に読み込ませることができません。
そこで思いついたのが、複数のMarkdownファイルを1つのファイルに統合するということです。
ネットに統合できるサービスがあったので試したのですが、うまくいっているのか分からず一旦やめました。
今度自分で統合するものを作ります。
次に考えたのが、実行したいドキュメントファイルだけを読み込ませるということです。
NFT関連のファイルを探していたところ、この記事の前半で使用していたSQLコードの使い方が書かれたファイルを見つけました。
コード生成
「これでいける!」と思い早速読み込ませて実行していました。
プロンプトは以下になります。
アップロードしたファイルの中身を読み込んでください。
0x67cBBb366a51FFf9ad869d027E496Ba49f5f6D55
アップロードしたファイルを参照して、上記のコントラクトアドレスの取引データを取得するSQLコードを教えてください。
出力結果は以下になります。
アップロードされたファイルは、Dune Analyticsが提供する nft.trades データベースの説明で、NFTの取引データを標準化して提供しています。データベースは、OpenSea、Rarible、SuperRare、CryptoPunks、Foundation、およびLooksRareなど、さまざまなプラットフォームからのデータを集約しています。
この情報を元に、指定されたコントラクトアドレスの取引データを取得するためのSQLクエリを提案します。
SELECT *
FROM nft.trades
WHERE nft_contract_address = '0x67cBBb366a51FFf9ad869d027E496Ba49f5f6D55';
上記のクエリは、指定されたNFTコントラクトアドレスに関連するすべての取引データを取得します。このデータには、取引のタイムスタンプ、買い手と売り手、取引プラットフォーム、取引額(USD換算)、トランザクションハッシュなどが含まれます。
ただし、このSQLクエリはDune Analyticsの環境でのみ実行可能で、ここで直接実行することはできません。Dune Analyticsのアカウントを作成し、そのプラットフォーム上で実行する必要があります。
いい感じに生成されています!
では早速「Dune Analytics」上で実行したところ、エラーが出ました...。
「コントラクトアドレスのクオーテーションがいらない!」と言われたので、消して以下のコードで再度実行したところ結果が出力されました🎉
SELECT *
FROM nft.trades
WHERE nft_contract_address = 0x67cBBb366a51FFf9ad869d027E496Ba49f5f6D55;
完全に生成されない原因を探していて気づいてのですが、どうやら「Dune Analytics」のドキュメントが最新ではないようです。
ドキュメントのSQLコードを実行してもエラーを吐かれるため、「Code Interpreter」に読み込ませるファイルがそもそも間違っていたことになります。
別のコードを生成
1つのコードを生成して満足していては良くないと思い、別のコードを生成してみました!
まずプロンプトは以下になります。
0x67cBBb366a51FFf9ad869d027E496Ba49f5f6D55
アップロードしたファイルを参照して、上記のコントラクトアドレスの直近1年間の取引データを取得するSQLコードを教えてください。
出力結果は以下になります。
コントラクトアドレス 0x67cBBb366a51FFf9ad869d027E496Ba49f5f6D55 の過去1年間の取引データを取得するためのSQLクエリは以下のようになります:
SELECT *
FROM nft.trades
WHERE nft_contract_address = '0x67cBBb366a51FFf9ad869d027E496Ba49f5f6D55'
AND block_time >= NOW() - INTERVAL '1 year';
このクエリは、過去1年間に指定されたNFTコントラクトアドレスで行われたすべての取引を返します。データは、取引のタイムスタンプ、買い手と売り手、取引プラットフォーム、取引額(USD換算)、トランザクションハッシュなどが含まれます。
ただし、このSQLクエリはDune Analyticsの環境でのみ実行可能で、ここで直接実行することはできません。Dune Analyticsのアカウントを作成し、そのプラットフォーム上で実行する必要があります。
「お?いい感じなのでは?」と思い意気揚々とDune Analyticsで実行しました。
結果は...エラーです。
どこがダメなんだ!
と思い別のタブでChatGPTを開き、エラー分とコードを入力して聞いたところ以下のSQLコードが出力されました。
SELECT
  *
FROM
  nft.trades
WHERE
  nft_contract_address = 0x67cBBb366a51FFf9ad869d027E496Ba49f5f6D55
  AND block_time >= NOW() - INTERVAL '1' year;
「ほんとにこれでいけるの?」と半信半疑で実行してみたところ、なんと通りました!!!
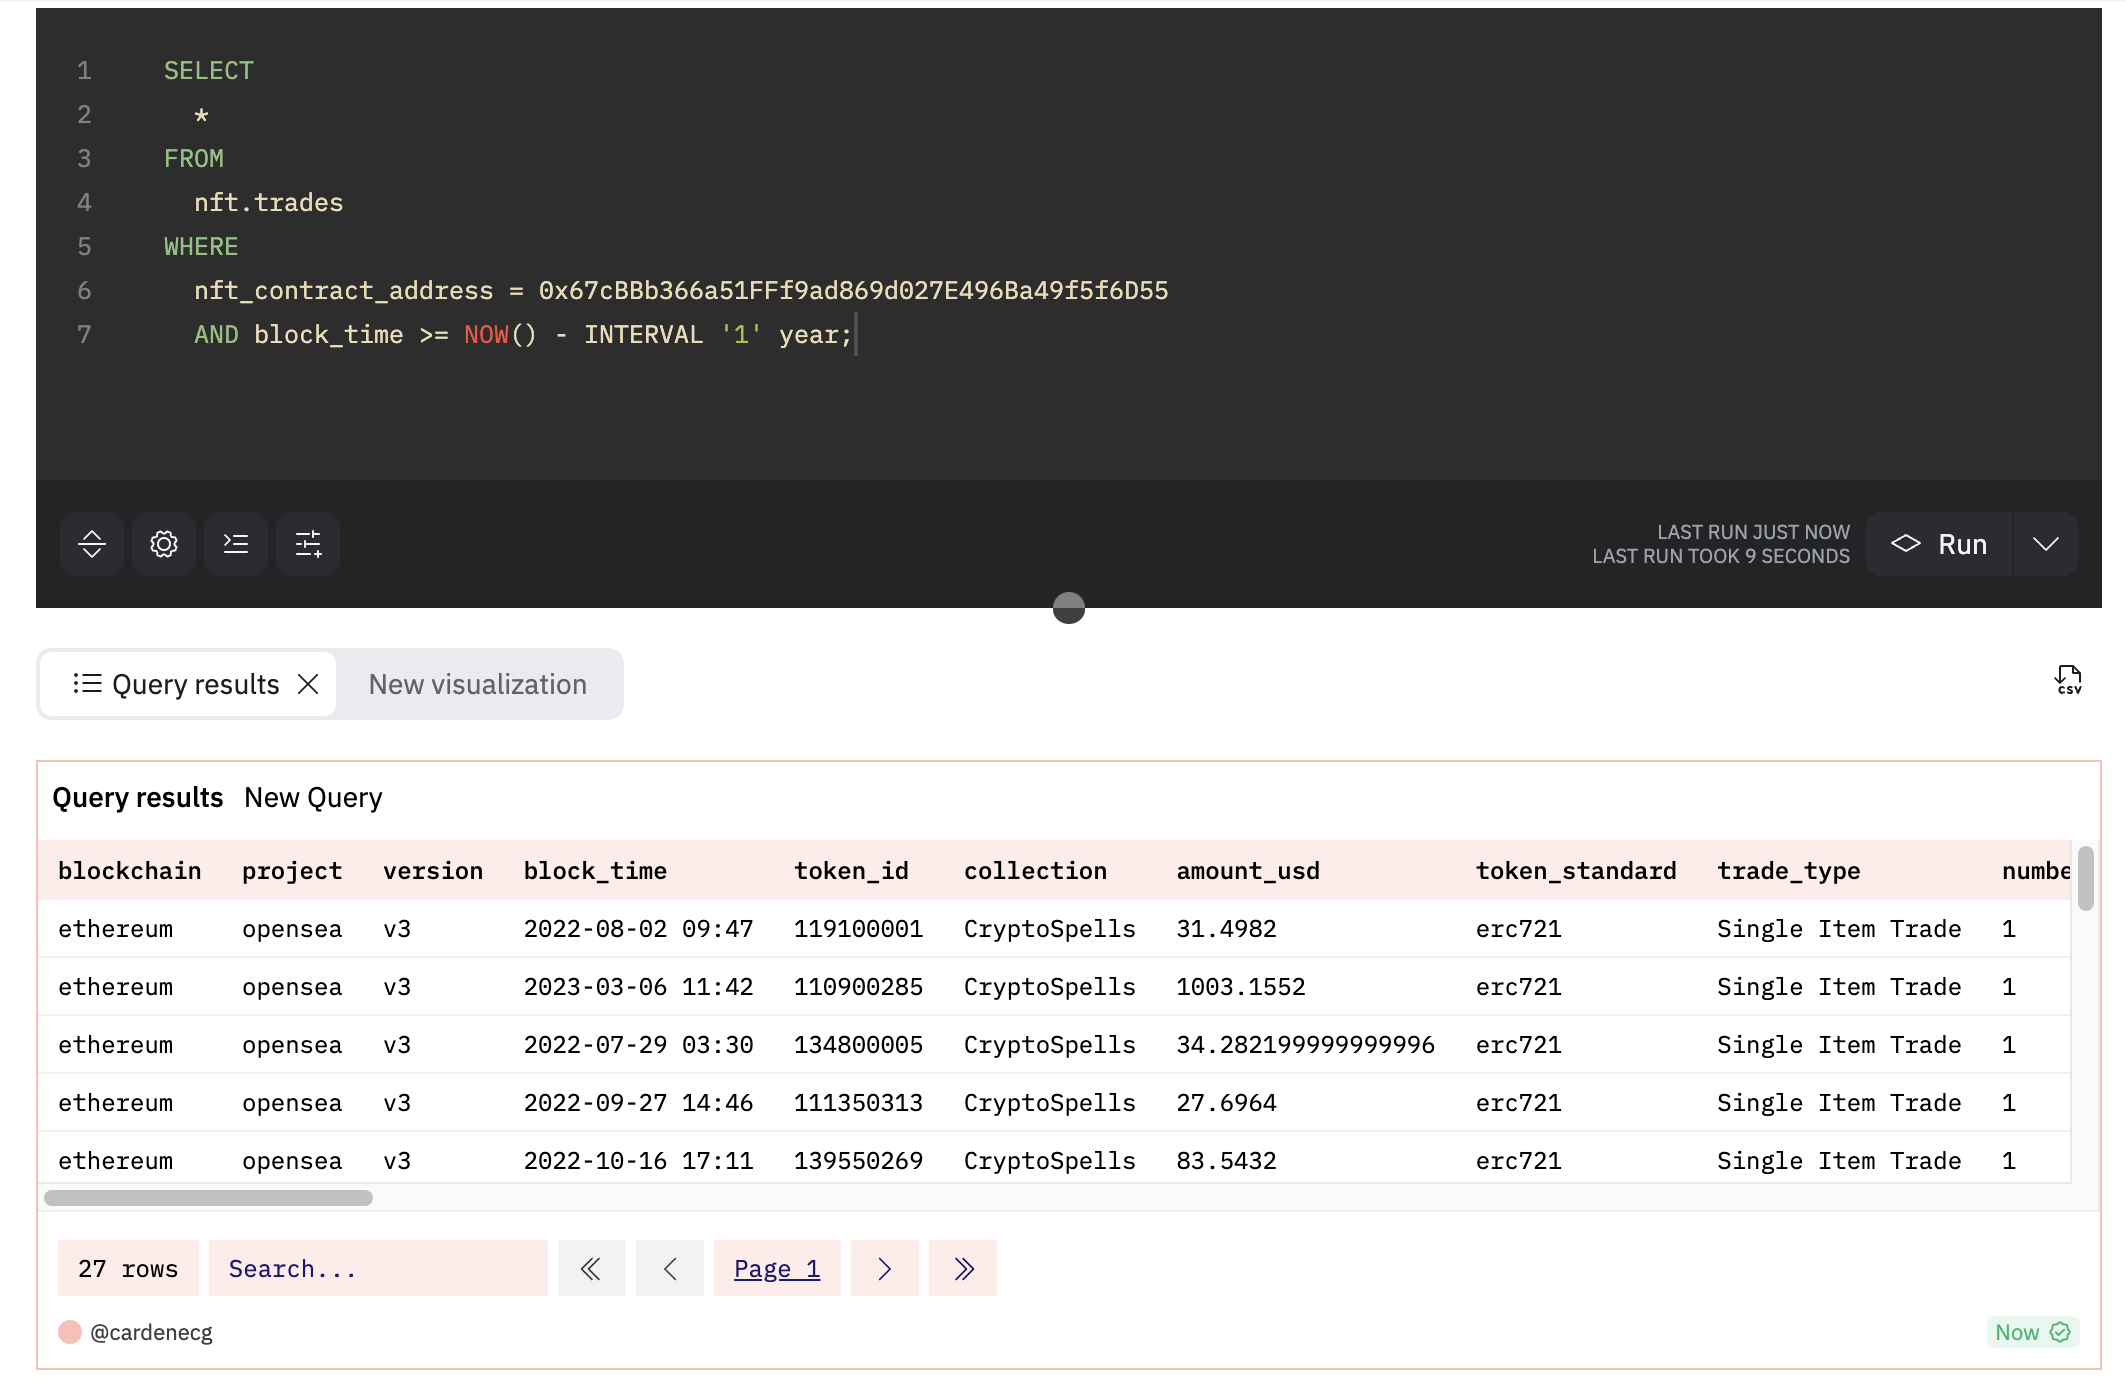
出力件数が激減しているので、別のパラメータの指定などが必要なのかもしれません。
この部分もやはり公式ドキュメントが古いままだったことが原因でした。
まさかChatGPTが公式ドキュメントよりも信頼できるとは思いませんでした。
再度チャレンジ
追加でさらに別のコードの生成をお願いしました。
プロンプトは以下になります。
0x67cBBb366a51FFf9ad869d027E496Ba49f5f6D55
アップロードしたファイルを参照して、上記のコントラクトアドレスの2022年の取引データを取得するSQLコードを教えてください。
出力結果は以下になります。
コントラクトアドレス 0x67cBBb366a51FFf9ad869d027E496Ba49f5f6D55 の2022年の取引データを取得するためのSQLクエリは以下のようになります:
SELECT *
FROM nft.trades
WHERE nft_contract_address = '0x67cBBb366a51FFf9ad869d027E496Ba49f5f6D55'
AND block_time >= '2022-01-01' AND block_time < '2023-01-01';
このクエリは、2022年に指定されたNFTコントラクトアドレスで行われたすべての取引を返します。データは、取引のタイムスタンプ、買い手と売り手、取引プラットフォーム、取引額(USD換算)、トランザクションハッシュなどが含まれます。
ただし、このSQLクエリはDune Analyticsの環境でのみ実行可能で、ここで直接実行することはできません。Dune Analyticsのアカウントを作成し、そのプラットフォーム上で実行する必要があります。
そのまま実行したところやはりエラーが出たので、ChatGPTに聞いたところ以下のSQLコードを提案されました。
SELECT
  *
FROM
  nft.trades
WHERE
  nft_contract_address = 0x67cBBb366a51FFf9ad869d027E496Ba49f5f6D55
  AND block_time >= CAST('2022-01-01' AS timestamp)
  AND block_time < CAST('2023-01-01' AS timestamp);
早速実行したところ通りました!
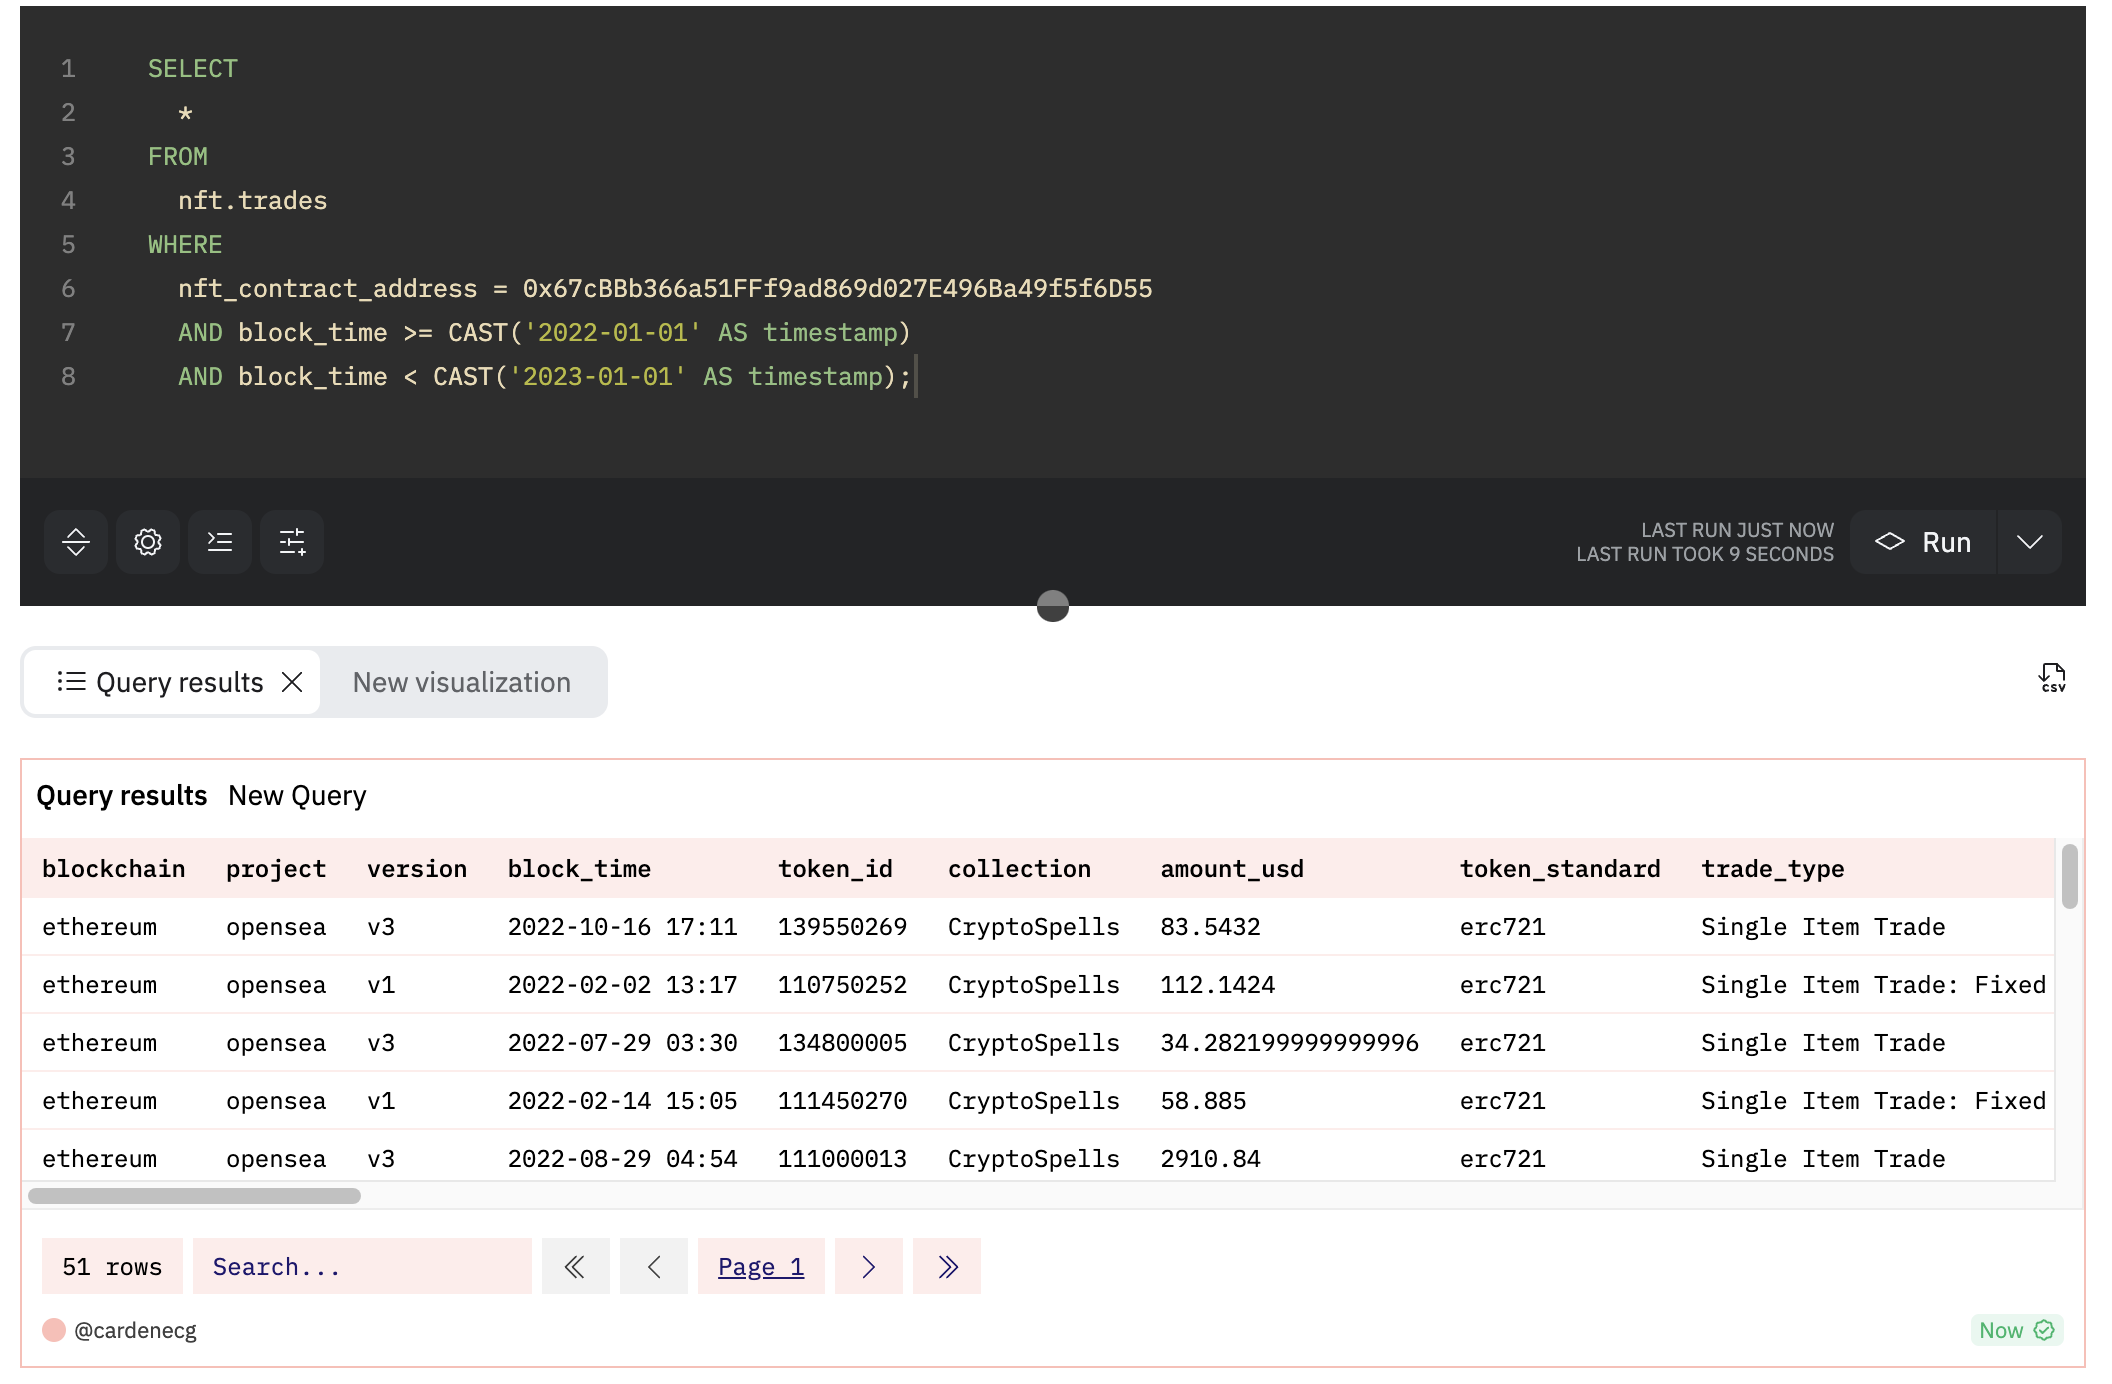
こちらも出力件数が激減しているので、別のパラメータの指定が必要そうですね🤔
今回の部分は公式キュメントにサンプルコードはなく、ドキュメントの一部を別の読み取り方をしてしまったことが原因だとみています。
ChatGPTの修正をChatGPTがしてしまう...。
使えば使うたび驚かされます。
結論
結論としては「ChatGPTしか勝たん!」です。
公式キュメントの間違いすら修正してしまうのには驚きました。
若干の課題点としては、グラフや表を生成するときにうまく生成できなかったので再度チャレンジしたいことです。
また、Code Interpreterに対してプロンプトを適切に指定しないとインターネットから探そうとしたりするので、「アップロードしたファイルを使用する」ということを伝えることが大切です。
ここで「Dune Analyticsで分析した方が早くない?」と思われた方がいるかもしれません。
それは人によっては事実です。
ただ、この記事ではCode Interpreterの素晴らしさや活用場面の1例をお見せしたかったため、ぜひその観点から読んでいただけると嬉しいです。
最後に
今回の記事では「ChatGPTのCode Interpreterを使用してNFTの取引データを分析をする」ということと、「Code Interpreterでコードの自動生成する」についてまとめてきました。
いかがだったでしょうか?
Code Interpreterは最近出てきたものなので、ぜひ皆さんも触ってみてください!
Code Interpreterは、まだまだできることがたくさんあると思うので自分も積極的に触っていこうと思います!
質問などがある方は以下のTwitterのDMなどからお気軽に質問してください!